Curiosity Blog, Sols 4988-4994: More New Tricks for an Old Dog
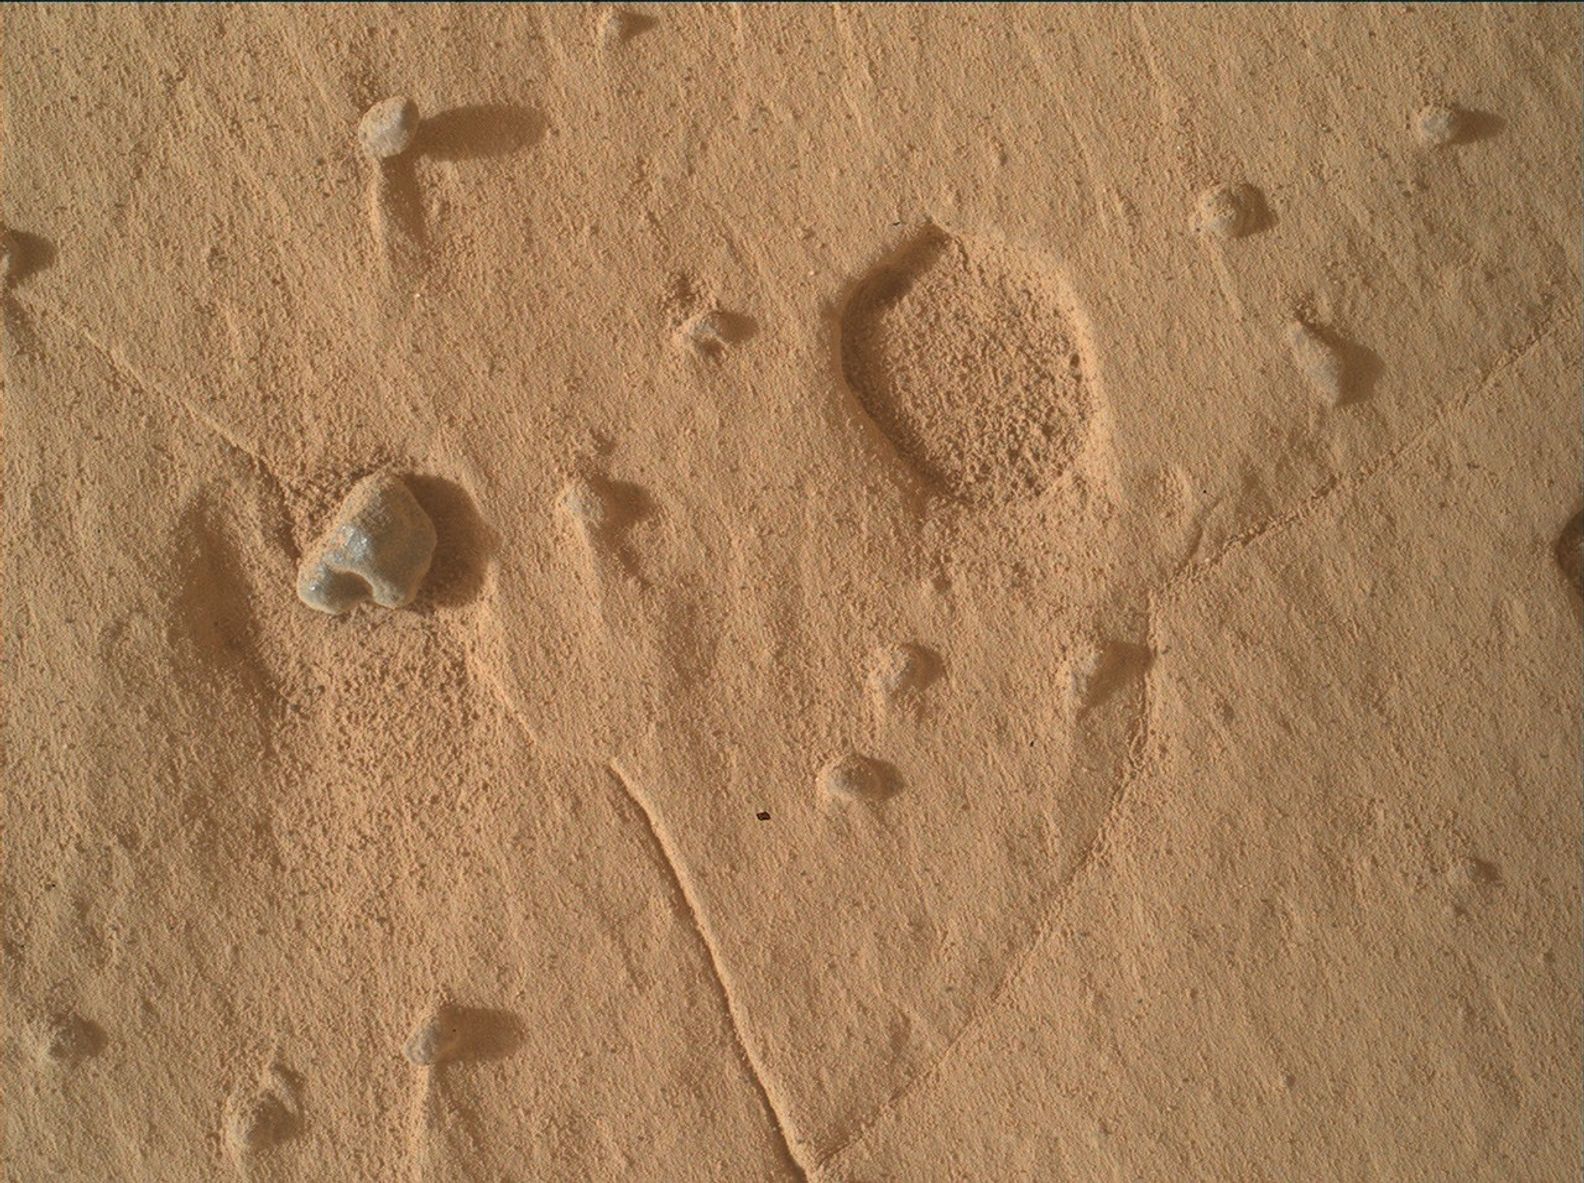
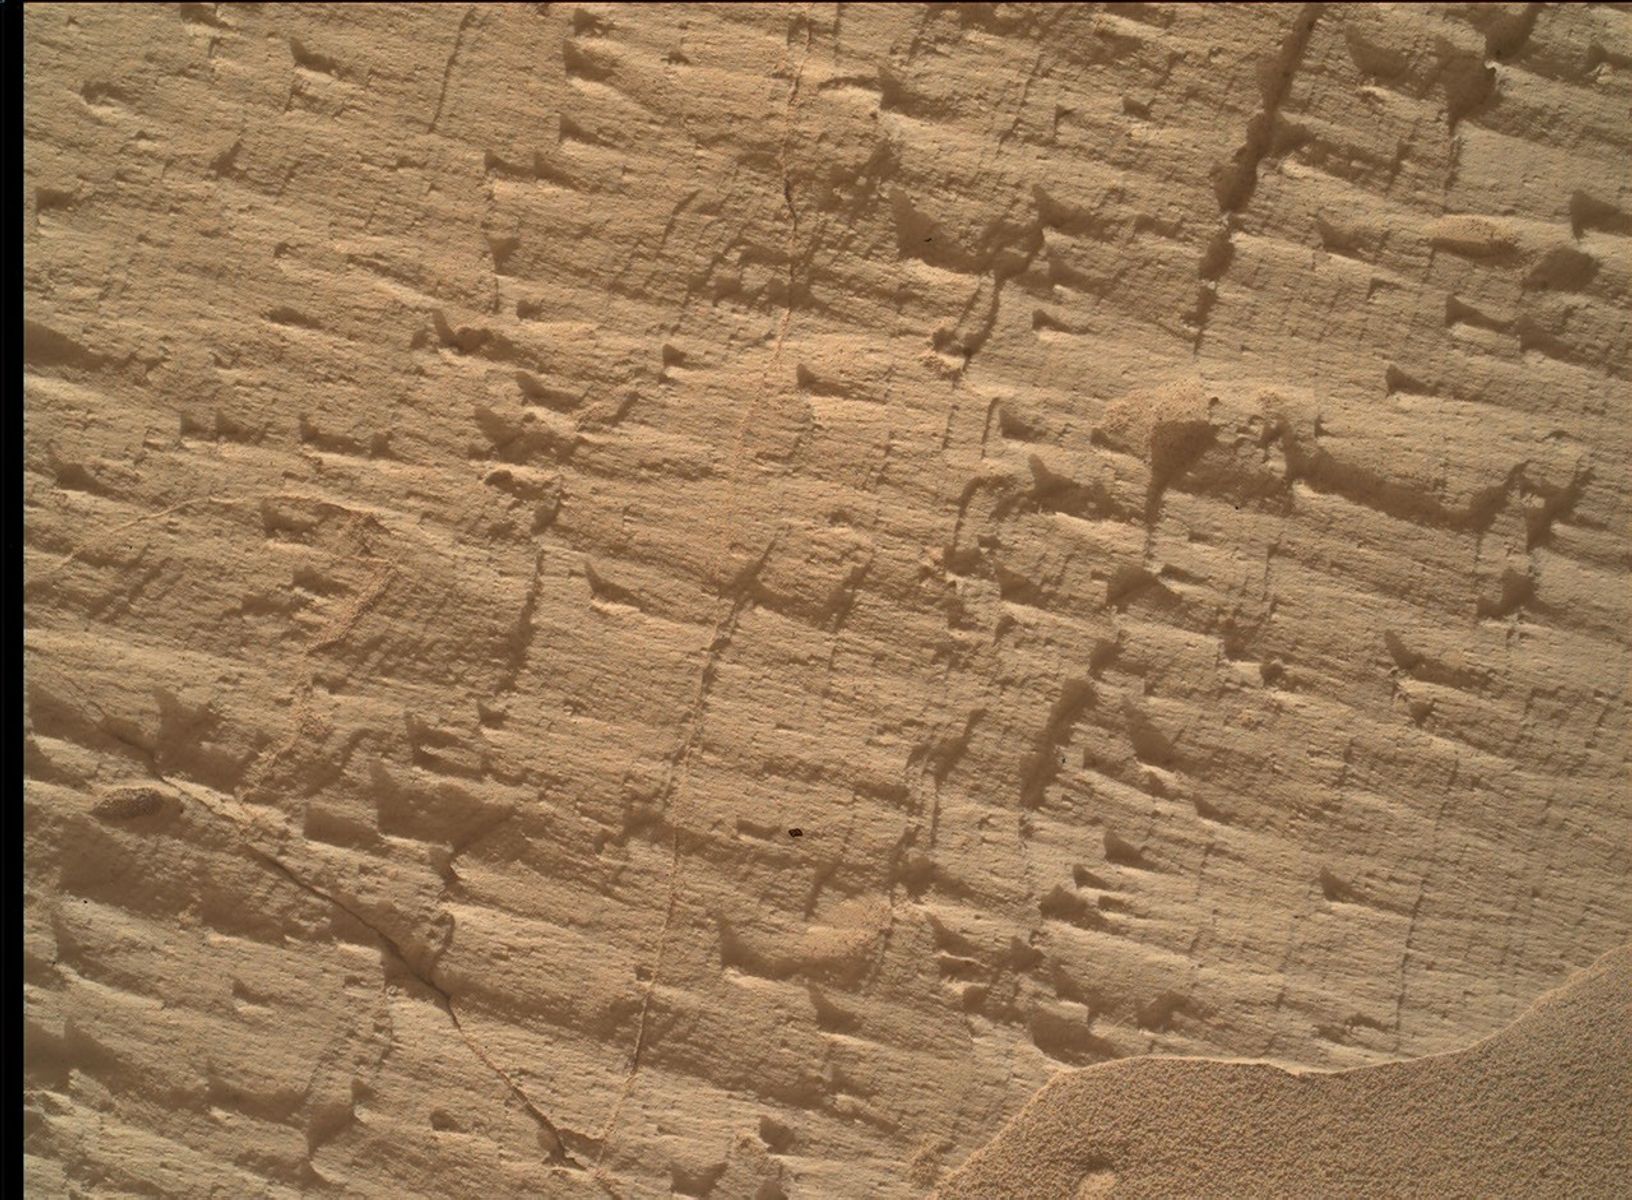
NASA’s Mars rover Curiosity acquired this image using its Mars Hand Lens Imager (MAHLI), showing an example of a broad pit that appeared in workspaces this week. The pit diameter is about 1 centimeter (0.39 inches). MAHLI is located on the turret at the end of the rover’s robotic arm, and uses an onboard focusing process to make a composite of images of the same target acquired at different focus positions, in order to make a single image that brings as many features into focus as possible. Curiosity created the composite on Aug. 19, 2026 — Sol 4989, or Martian day 4,989 of the Mars Science Laboratory mission — at 07:59:21 UTC.
NASA/JPL-Caltech/MSSS
Written by Michelle Minitti, MAHLI Deputy Principal Investigator
Earth planning date: Friday, Aug. 21, 2026
After Curiosity’s 14 years on the surface, Mars continues to surprise. Both of our workspaces this week contained features unlike quite anything we have seen in the past — broad, shallow pits (like the one in the image above) dotted across the bedrock. Pits are not uncommon — when resistant nodules or pebbles weather out of their host rock, they leave behind a void. But the pits of this week were much broader and shallower than past features and were not accompanied by obvious objects that were once in the pits. MAHLI and Mastcam were particularly interested in these features, acquiring stereo mosaics of them and tightly overlapping image sets that can be turned into a digital elevation model of their structure. They were a welcome new puzzle into the processes that have affected this particular section of rocks in the stratigraphy of Mount Sharp.
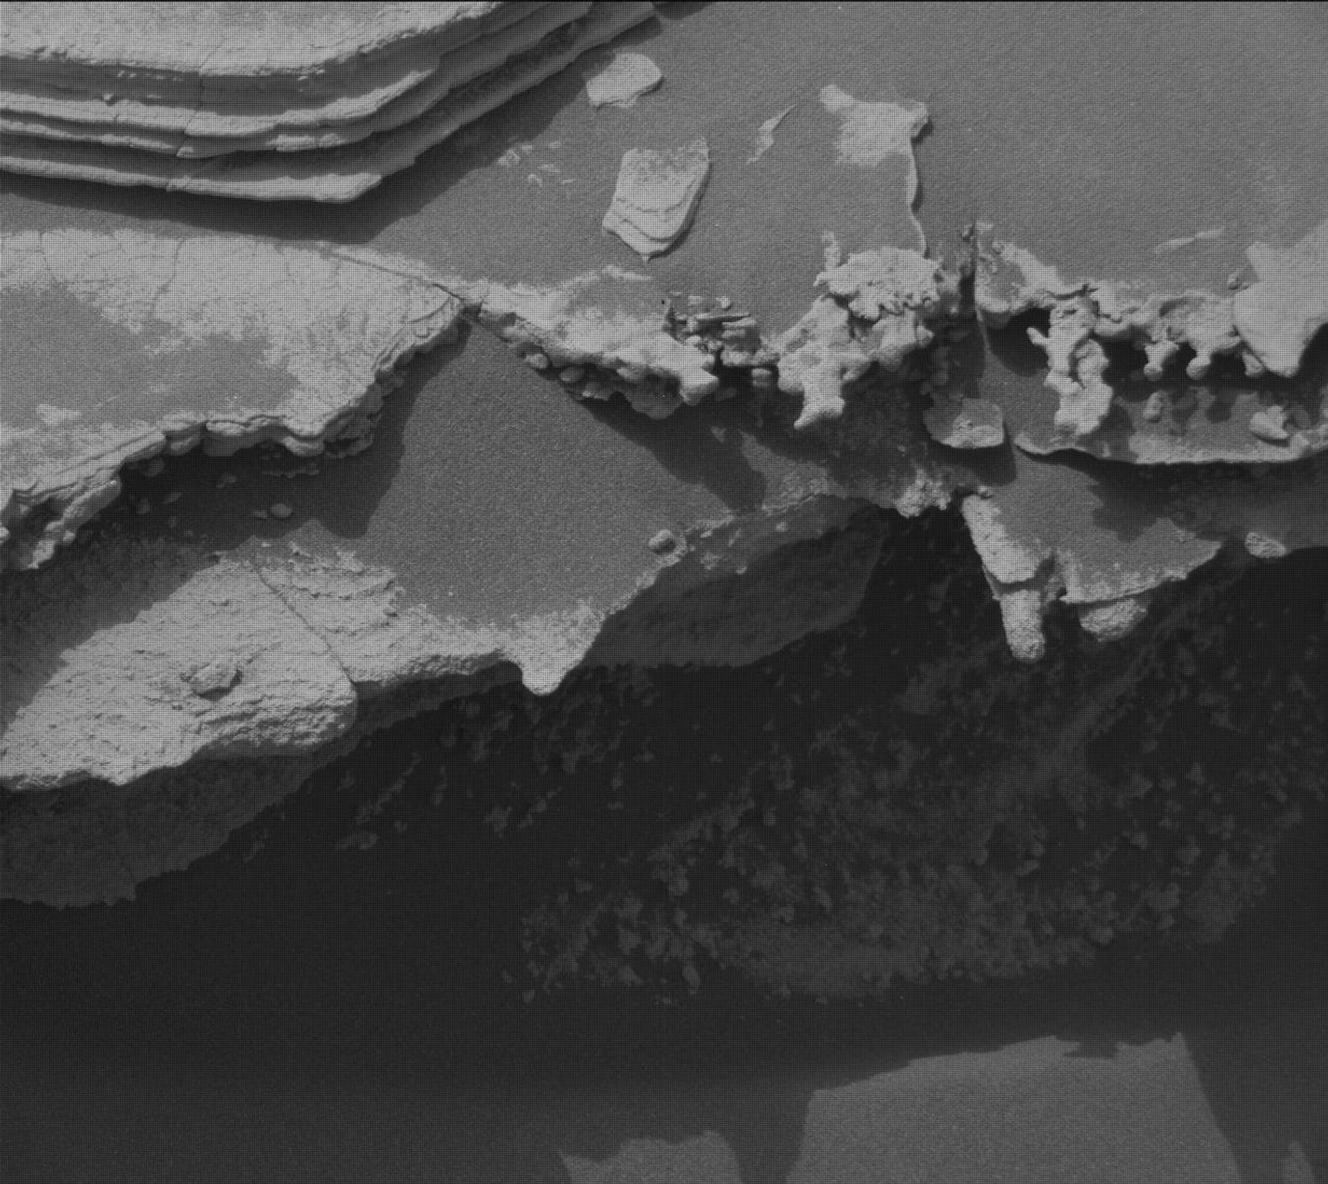
The “typical” bedrock was anything but boring. Mastcam imaged and ChemCam rastered across complex packages of layers with changes in texture and structure over short vertical differences. These might be evidence of changes in depositional conditions captured in close proximity to one another. ChemCam, MAHLI, and APXS analyzed gray, rough, resistant layers that differed from the host bedrock, likely indicative of a different chemistry. ChemCam studied one of the gray float rocks (like the small, loose pebble in the image above) that have been scattered variably across our workspaces, to try to understand the origins of these stones. Farther afield, the “Cordillera” butte continued to garner attention, with a comprehensive Mastcam mosaic covering its entire visible face, and more focused ChemCam RMI mosaics aimed at specific horizons. The “Tolhuaca” and “Potosí” buttes, which are farther south down “Valle Grande,” were also targets, with ChemCam looking for potential crossbedding and assessing the mineralogy of dark material capping Potosí.
Our environmental science team members were just as busy, planning REMS, Mastcam, and Navcam activities at a higher-than-usual cadence to monitor a potential regional dust storm. They found by the end of the week, however, that the storm appeared to be dissipating.
We managed to accomplish all of this despite having lost one of our planning days due to a lost downlink.
NASA’s Earth-observing satellite missions track dozens of features of a changing planet — aerosols, sea levels, land cover, cloud cover — over years and decades. Sustaining that record for the scientific and operational communities who depend on it requires more than engineering talent. It requires planning for an uncertain future: anticipating where a mission delay or on-orbit event might create a gap in the data those communities rely on.
Lindsey Jacobson’s work helps NASA anticipate those disruptions before they happen and gives senior leaders options for managing them. A Pathways intern in engineering, Jacobson supports NASA’s Earth Science Division through the NASA Earth Science Strategic Integration Environment (NESSIE) team within the Systems Analysis and Concepts Directorate (SACD) at NASA’s Langley Research Center in Hampton, Virginia.
NASA’s Pathways program connects undergraduate and graduate students with NASA centers through internships that, with satisfactory performance, can lead to full-time civil service positions. Jacobson has returned to NASA Langley every summer since 2022, splitting her time between the center and finishing her mechanical engineering dissertation at North Carolina State University.
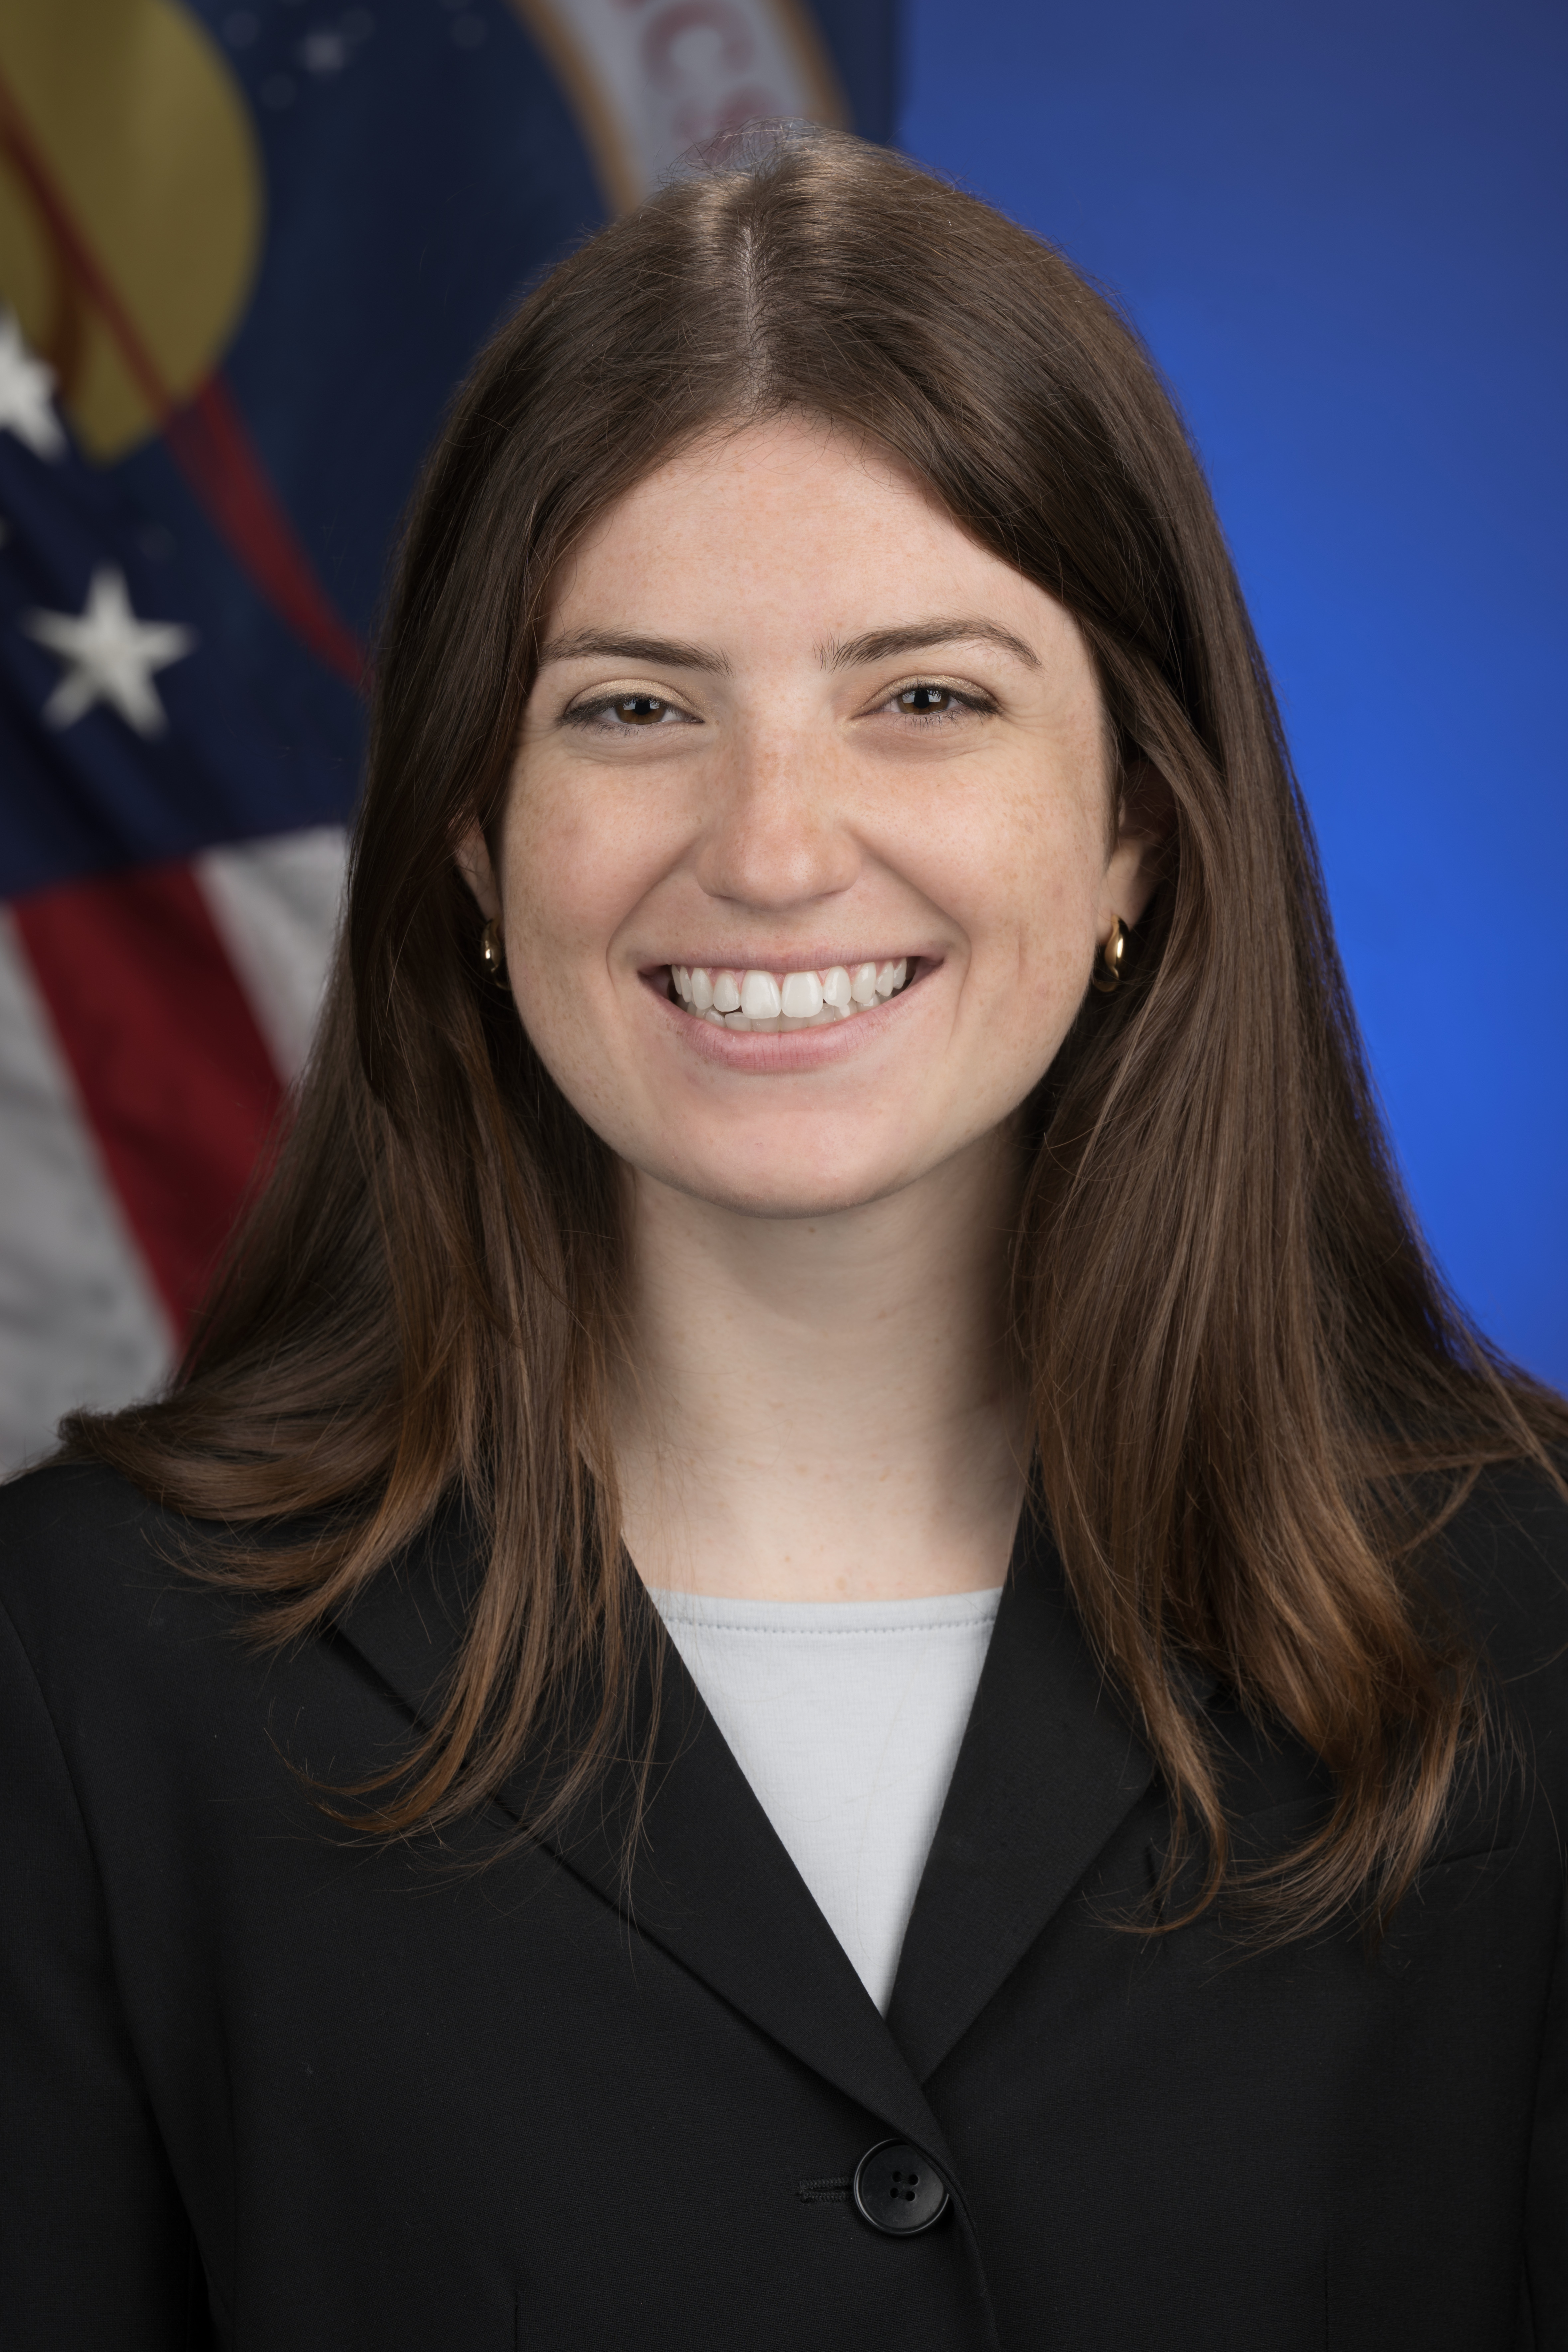
Lindsey Jacobson, Pathways Intern
Credit: NASA
“The way we do Earth science is changing.“
The Problem Space
Jacobson and the NESSIE team support the Earth science satellite portfolio — dozens of missions, each measuring specific features of the planet, from clouds to sea surface temperature to land use. The goal is providing end user communities with the data products they depend on. The challenge is the unknown.
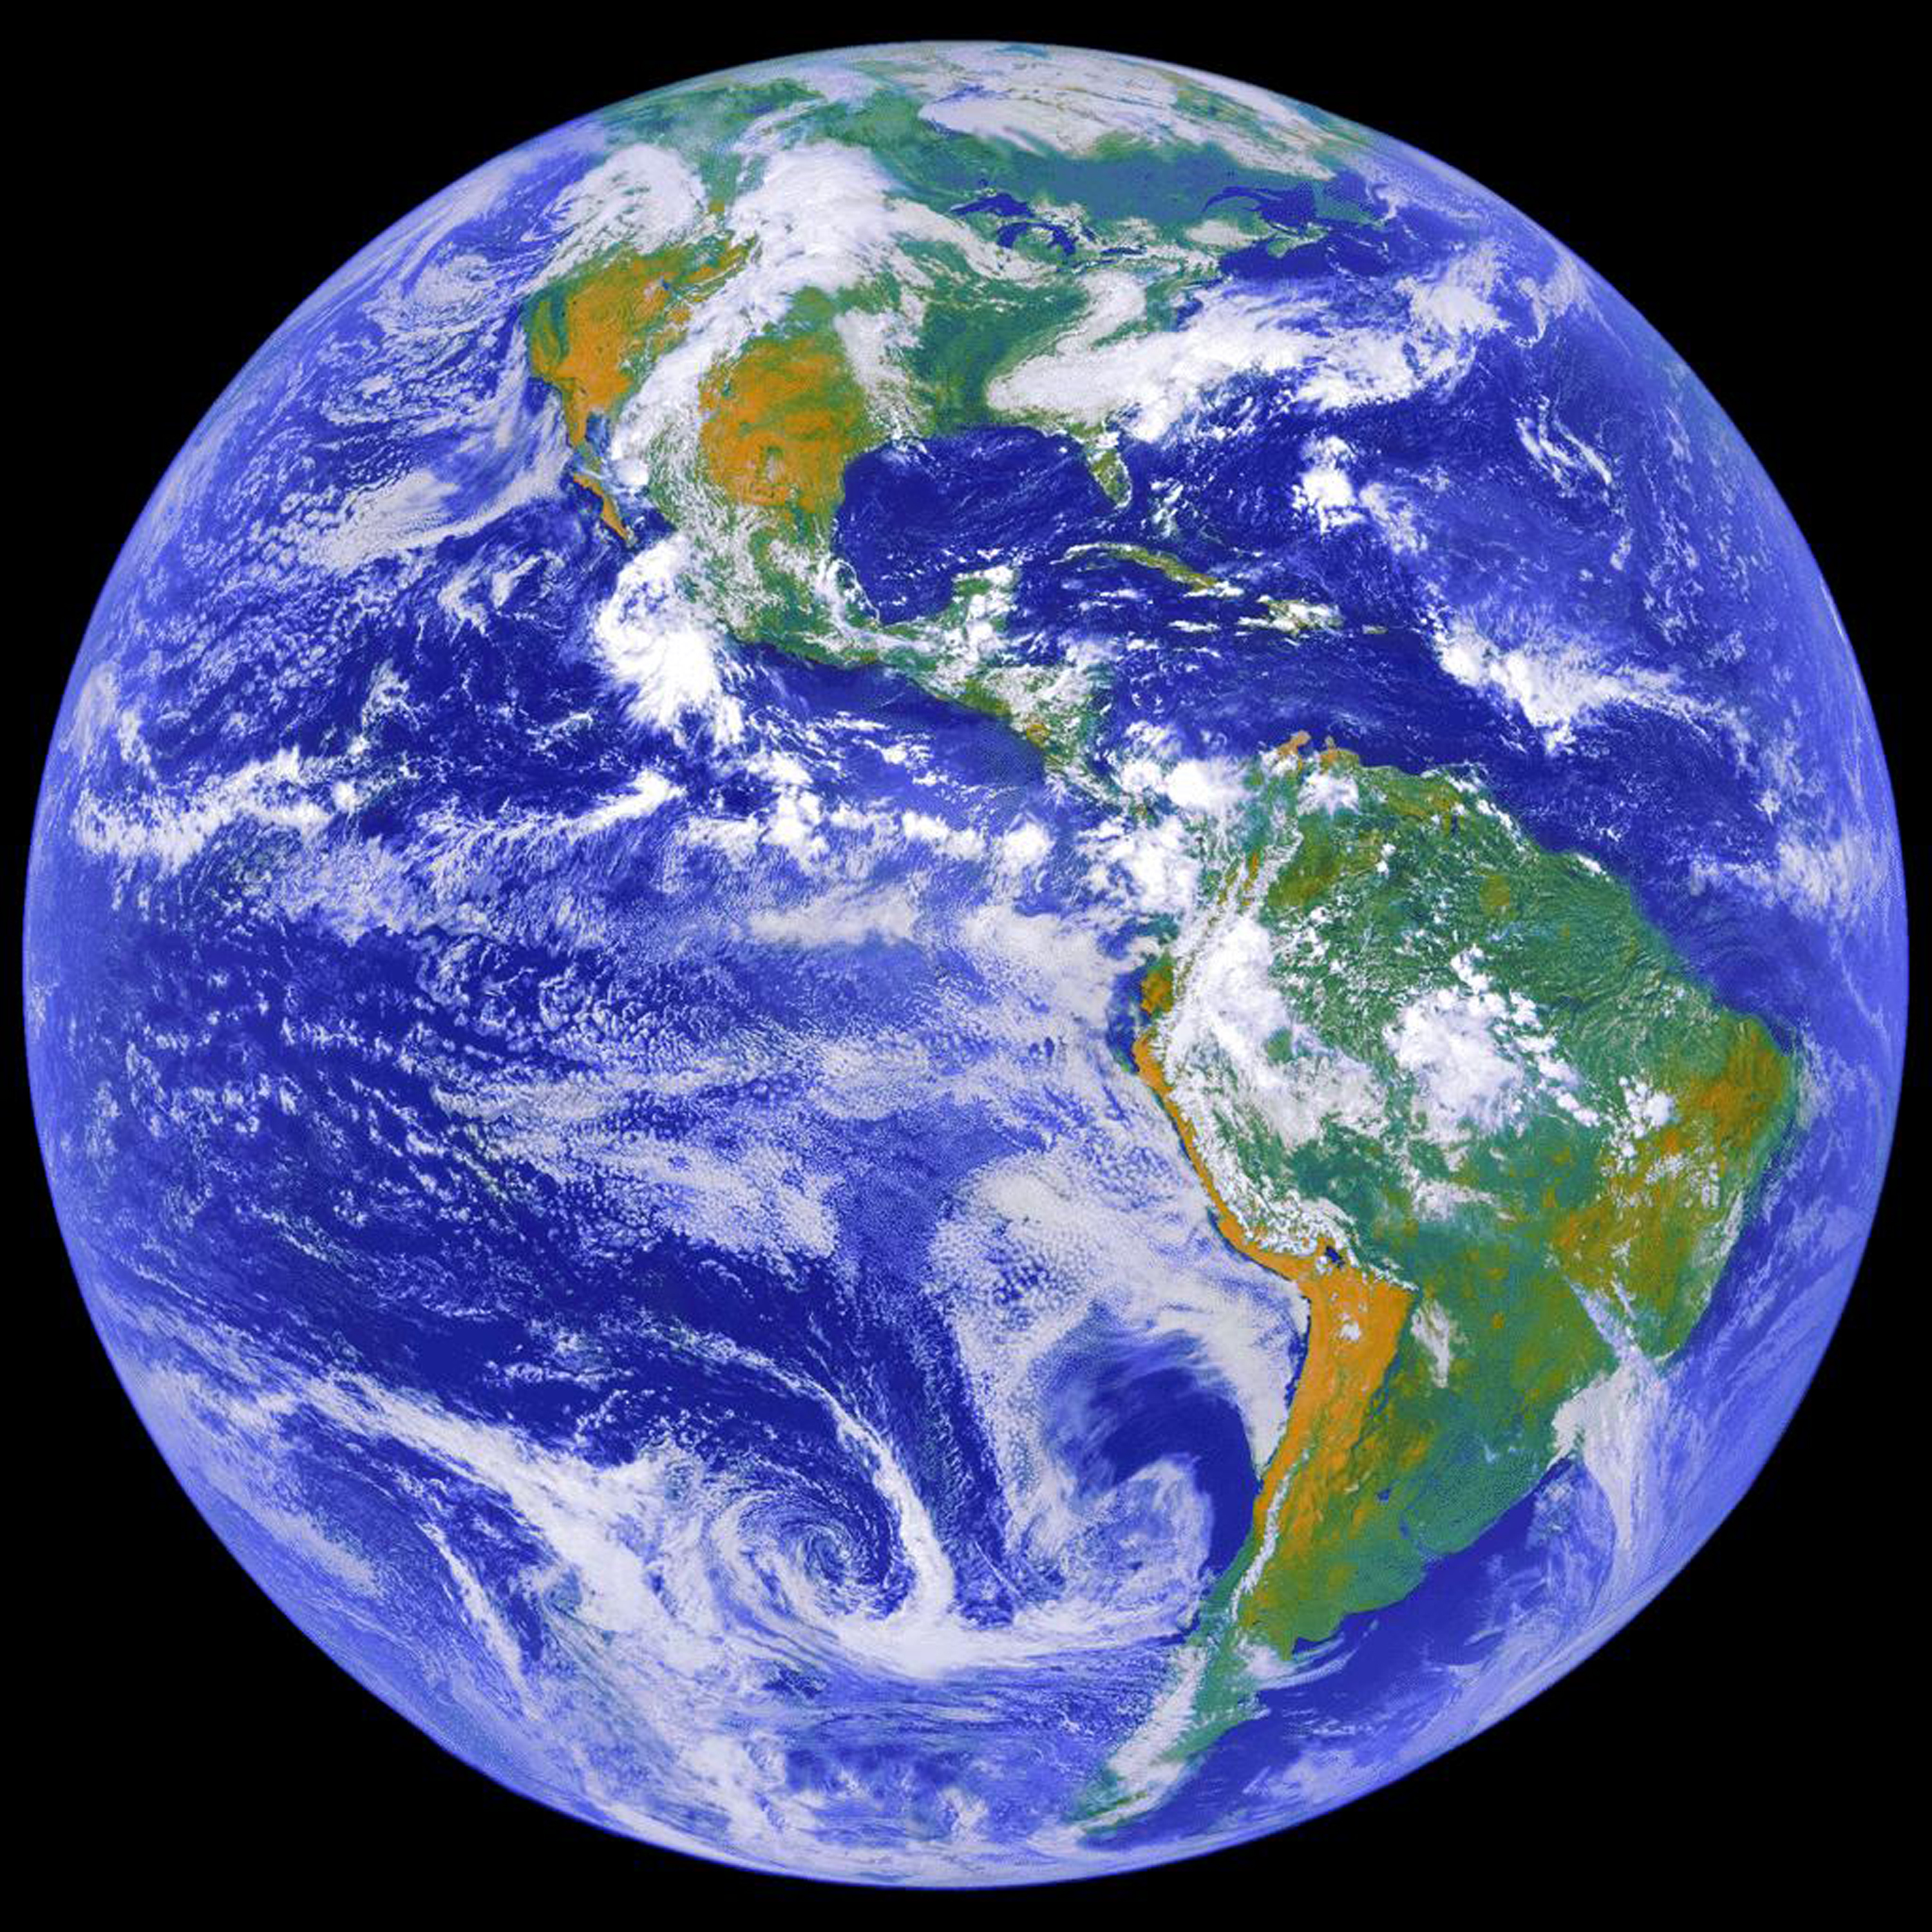
This image depicts a full view of the Earth, taken by the Geostationary Operational Environment Satellite (GOES-8), a satellite that was in service from 1994-2004. It was owned and operated by the National Oceanic and Atmospheric Administration (NOAA) and provided the kind of continuous monitoring necessary for intensive data analysis.
Credit: NASA
“There’s uncertainty about mission lifetimes and what could happen on orbit, and about schedules,” Jacobson explains. The team’s work gives NASA’s senior leadership a way to navigate that uncertainty: understanding where a gap in coverage might emerge and identifying options to mitigate or hedge against it. By providing alternative pathways for meeting end-user needs, this work supports senior leaders in managing a complex, interdependent portfolio.
Writing the Code
Within that effort, Jacobson’s focus is building analysis tools that give the team what she calls a “foresight ability.”
“It’s the ability to anticipate different things that might happen — changes that might occur across the portfolio of Earth-observing missions — and to have strategies in mind for how to respond, so we can keep delivering data to end users,” she says.
Not every change is bad news. Missions sometimes operate well beyond their planned lifespan, creating room to extend their value. But whether an adjustment is welcome or not, the principle is the same: know the options before anything happens.
Jacobson compares it to preparing for hurricane season. “You get the storm shutters, you buy the sandbags, and you have them pre-positioned,” she says. “Then when the warning comes, you’re not scrambling, and you’re not at risk of the store selling out. You already have what you need in place.” NESSIE’s work follows the same logic for the Earth-observing portfolio by understanding ahead of time what a disruption might mean and having a set of responses ready before anything happens.
“We proactively suggest the strategies and alternatives that could be enacted if there’s a change,” Jacobson says. “We do that ahead of time, so people understand what options might exist.”
Her approach carries echoes of her graduate research, which examines how complex systems — infrastructure that can’t simply be torn down and rebuilt, like the electric grid — must evolve deliberately instead. “We designed a grid, and now we live with that grid forever,” she says. “We can’t tear it down and build a new one. What we can do is modify, expand, and improve upon what we have.” It’s the same instinct for working with what exists, rather than starting from scratch, that shapes how she approaches her work at NASA.
Keeping Pace
Engineers arriving at NASA for the first time might expect the hardest part of the job to be technical. Jacobson found something else: the landscape itself is what demands the most adaptability.
“The way we do Earth science is changing,” she says. Commercial companies are increasingly contributing data alongside government agencies. New space agencies are entering the field. Innovative technologies and architectures are emerging all the time. Keeping pace with that shift — understanding how NASA’s own capabilities are evolving and how to best serve the communities that depend on the data — is as much a part of the job as any calculation.
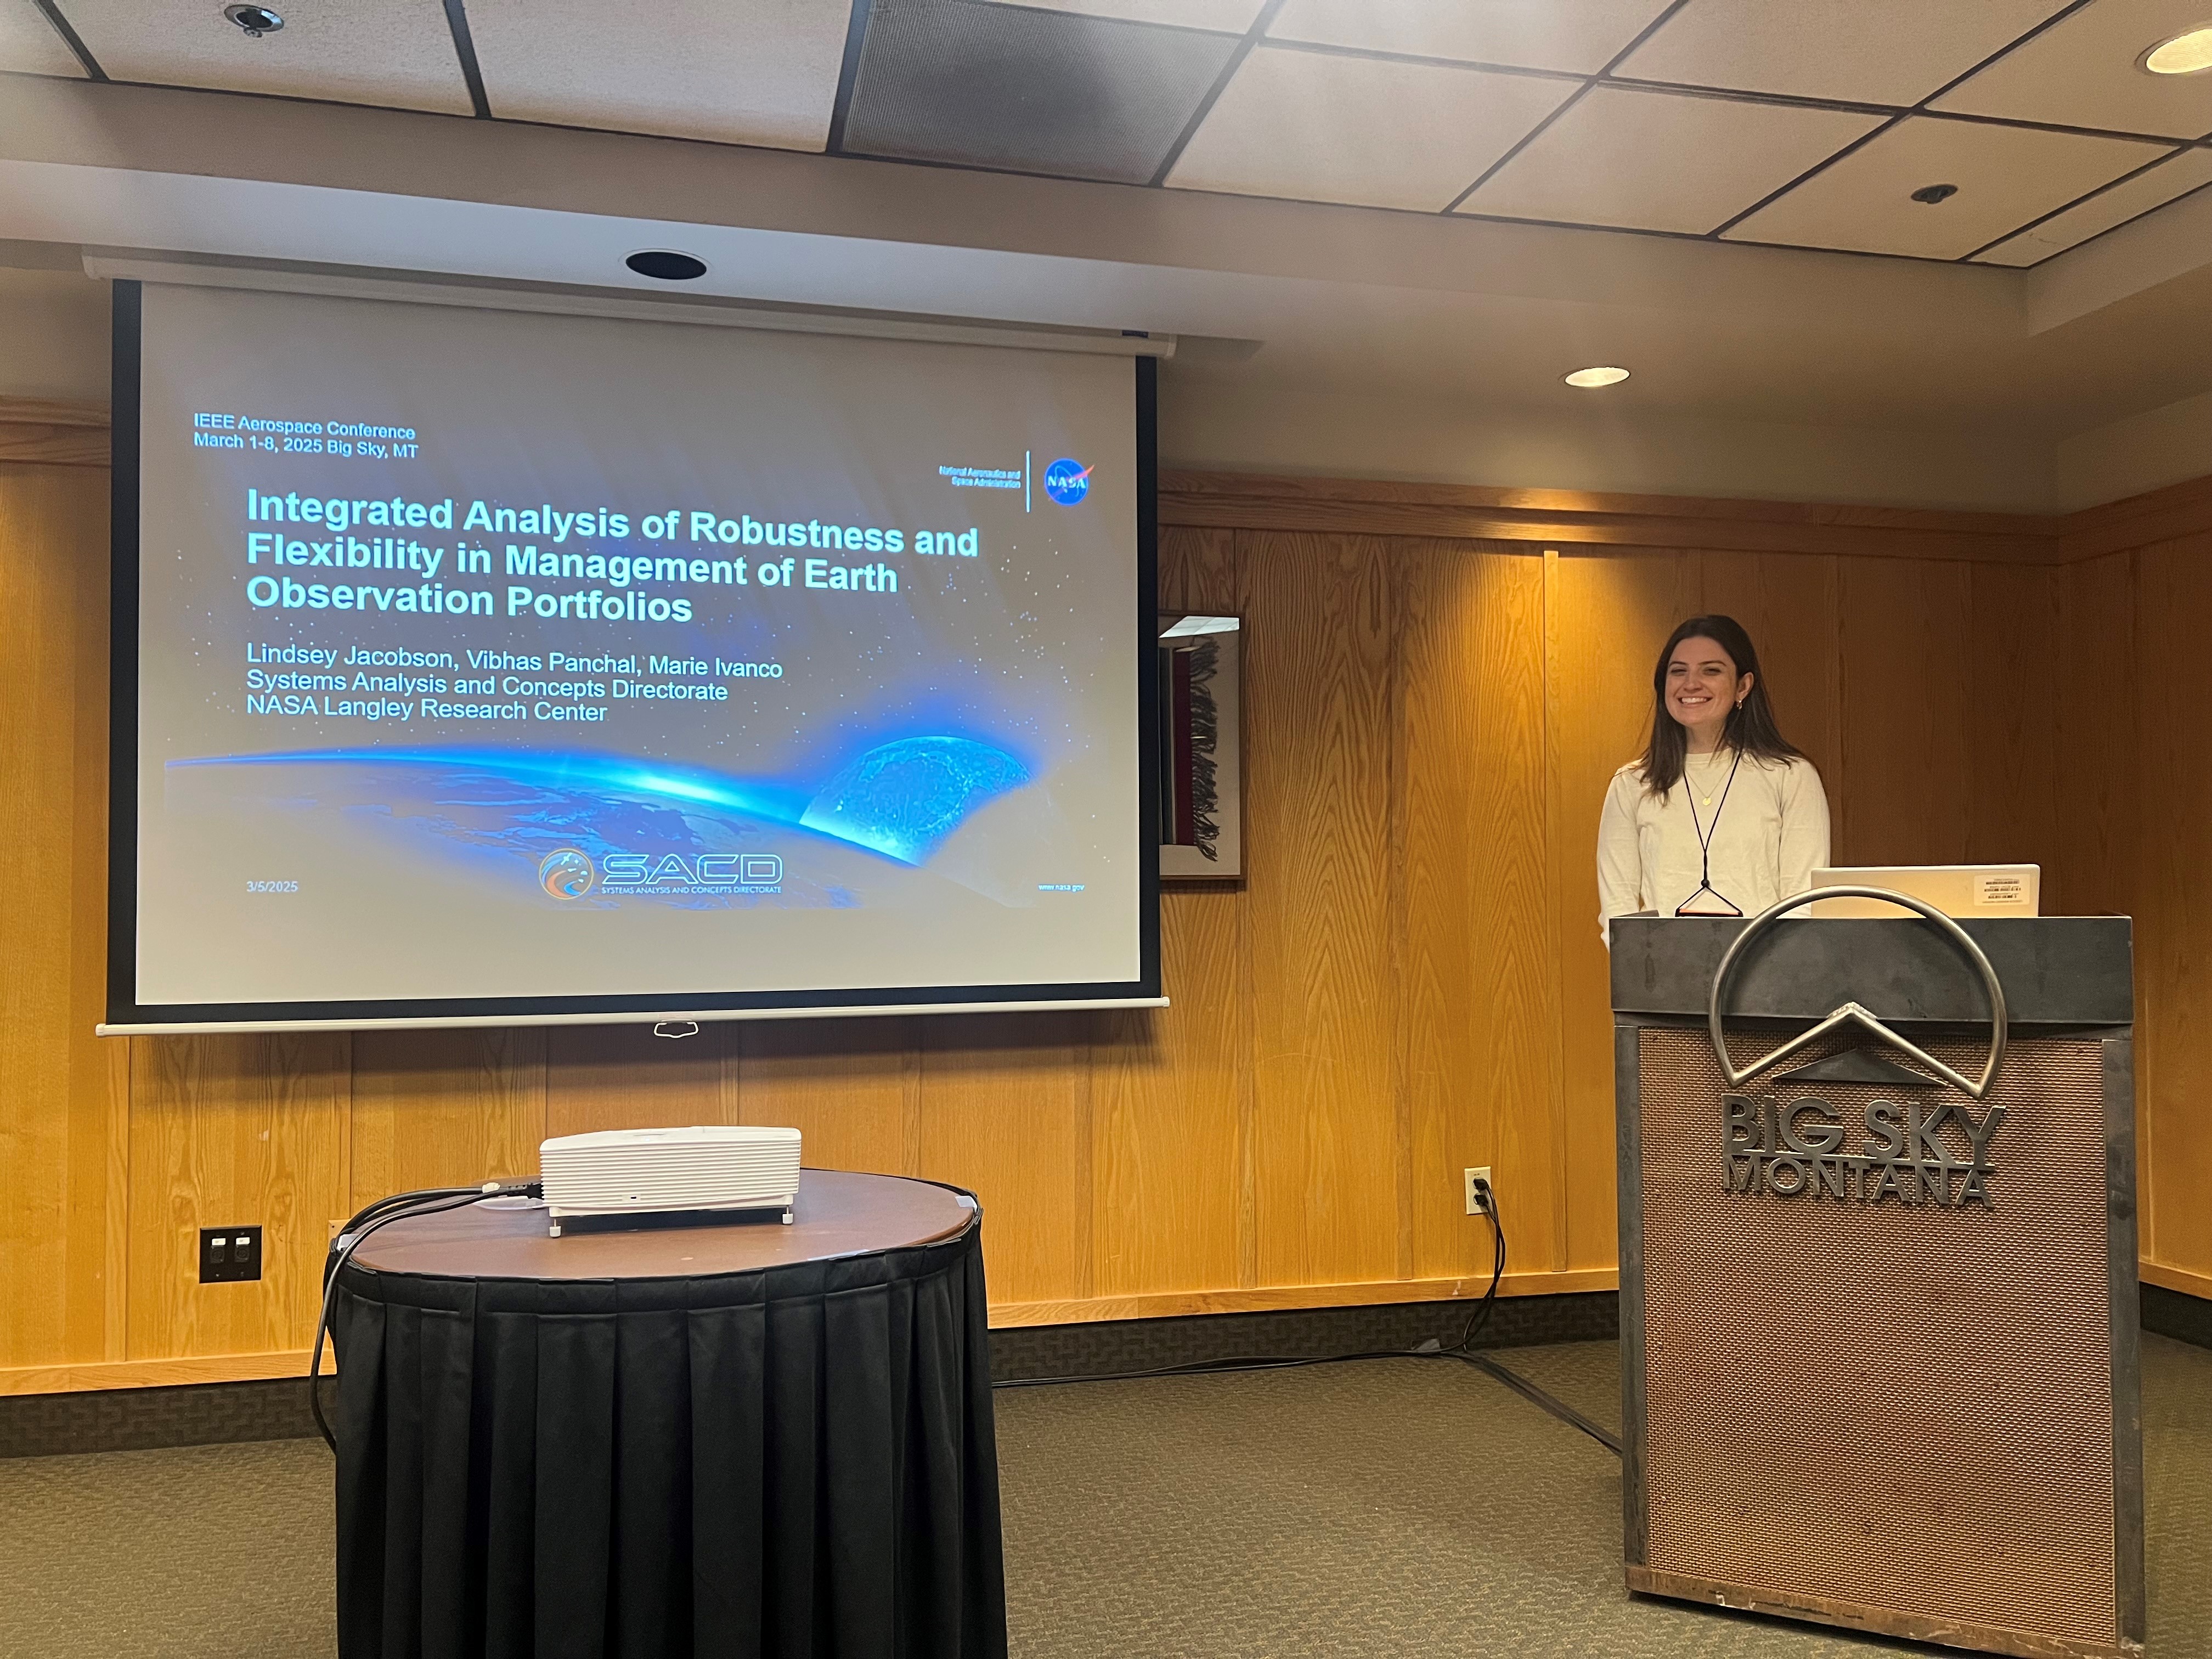
Jacobson presenting NESSIE’s work on managing portfolios of Earth-observing missions to meet science needs despite uncertainties in mission scheduling and lifetimes, Institute of Electrical and Electronics Engineers (IEEE) Aerospace Conference, 2025.
Credit: NASA
Some of that adaptability shows up in smaller ways too, like the growing role of AI tools in her team’s own workflow. “Langley has done a lot of firsts,” Jacobson says, echoing something she heard recently from Trina Dyal, NASA Langley’s director, at an intern event. “And we want to continue to be the first. That means learning new things and figuring out how to bring them into how we work.”
On Jacobson’s Sci-Fi Shelf
The Sirens of Titan by Kurt Vonnegut
Jacobson received this novel in high school, let it sit on her shelf for years, and finally picked it up during the pandemic.
“It was very special. It touches a lot on the meaning of life, and that connects to some of the reasons I was motivated by space in the first place. The idea that space exploration can bring humanity together. That cosmic perspective.”
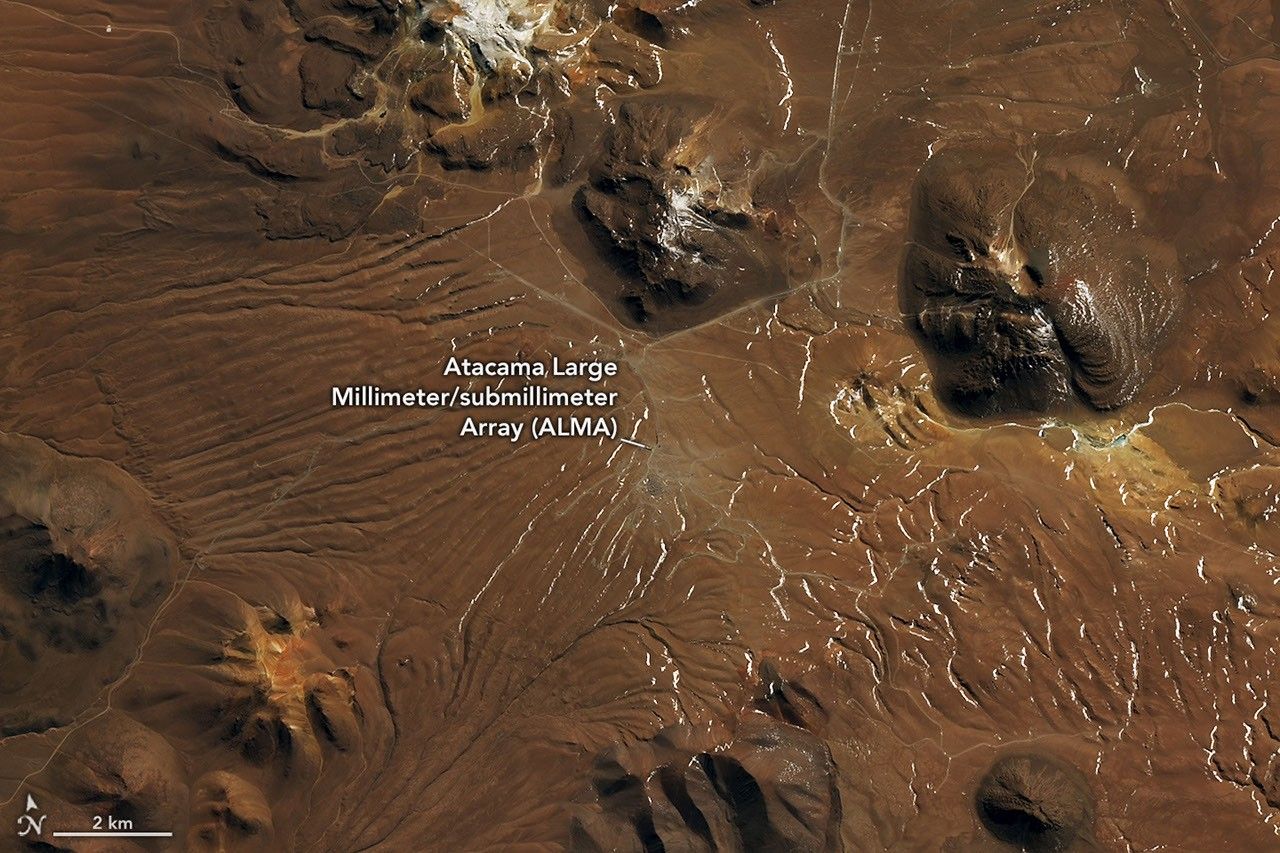
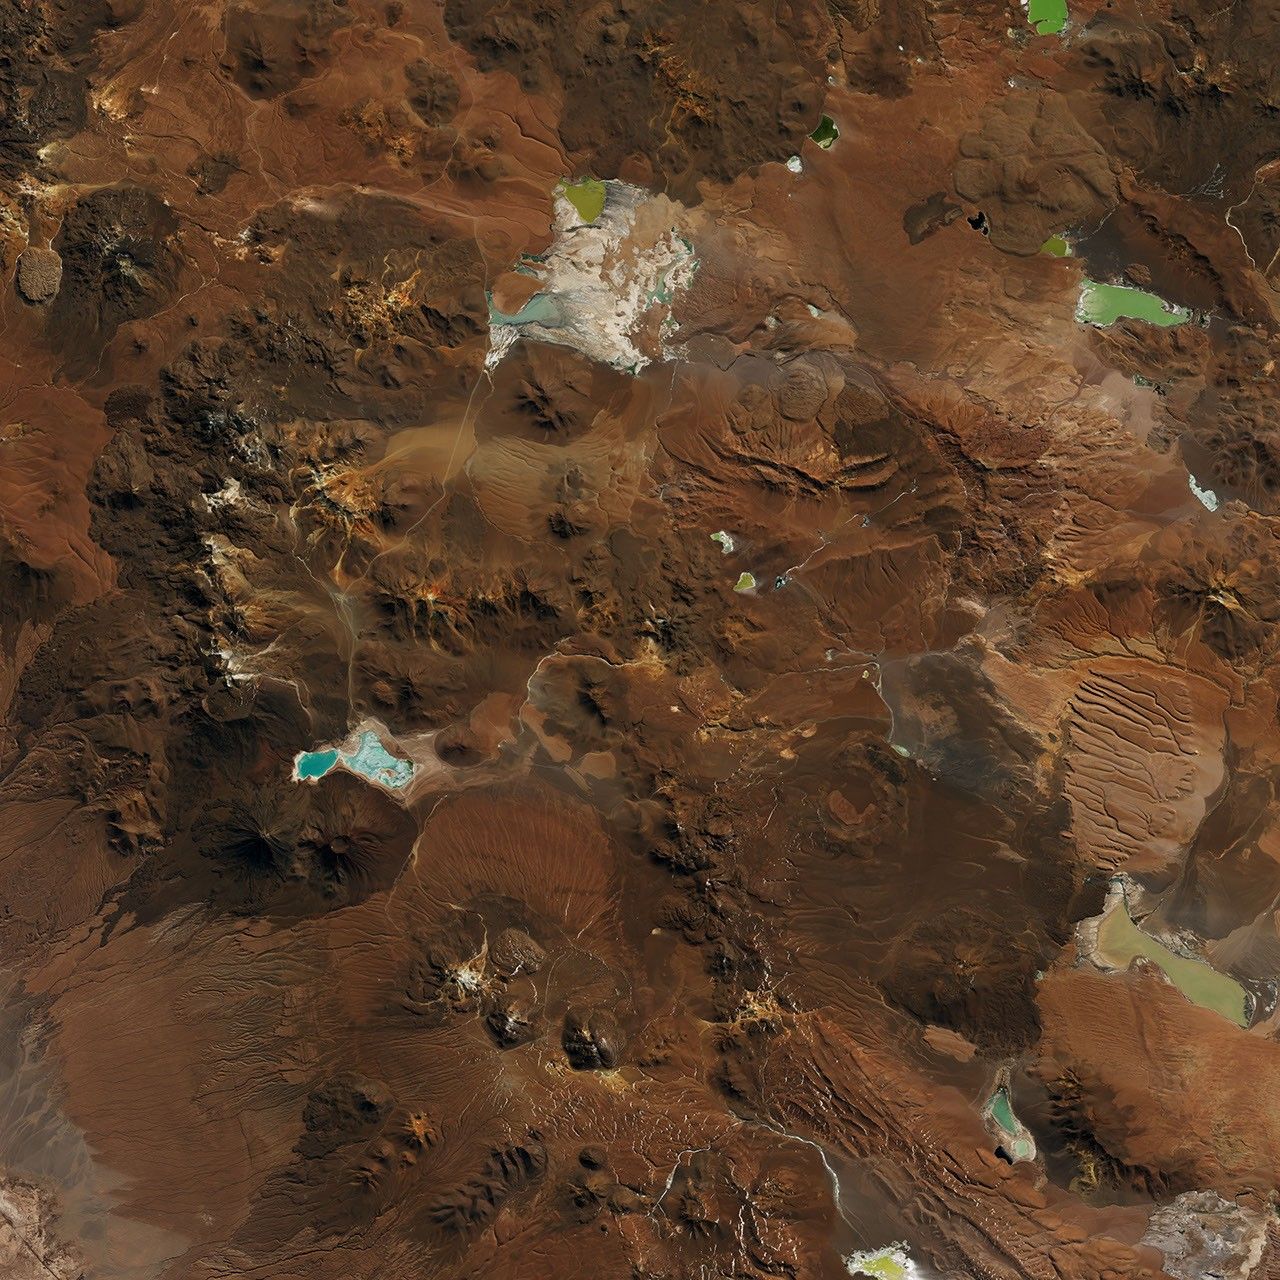
A plateau in the Chilean Andes is surrounded by stratovolcanoes and lava domes. The dry, mostly brown landscape has a lighter brown patch near the center, marking the radio telescope array.
NASA Earth Observatory / Lauren Dauphin
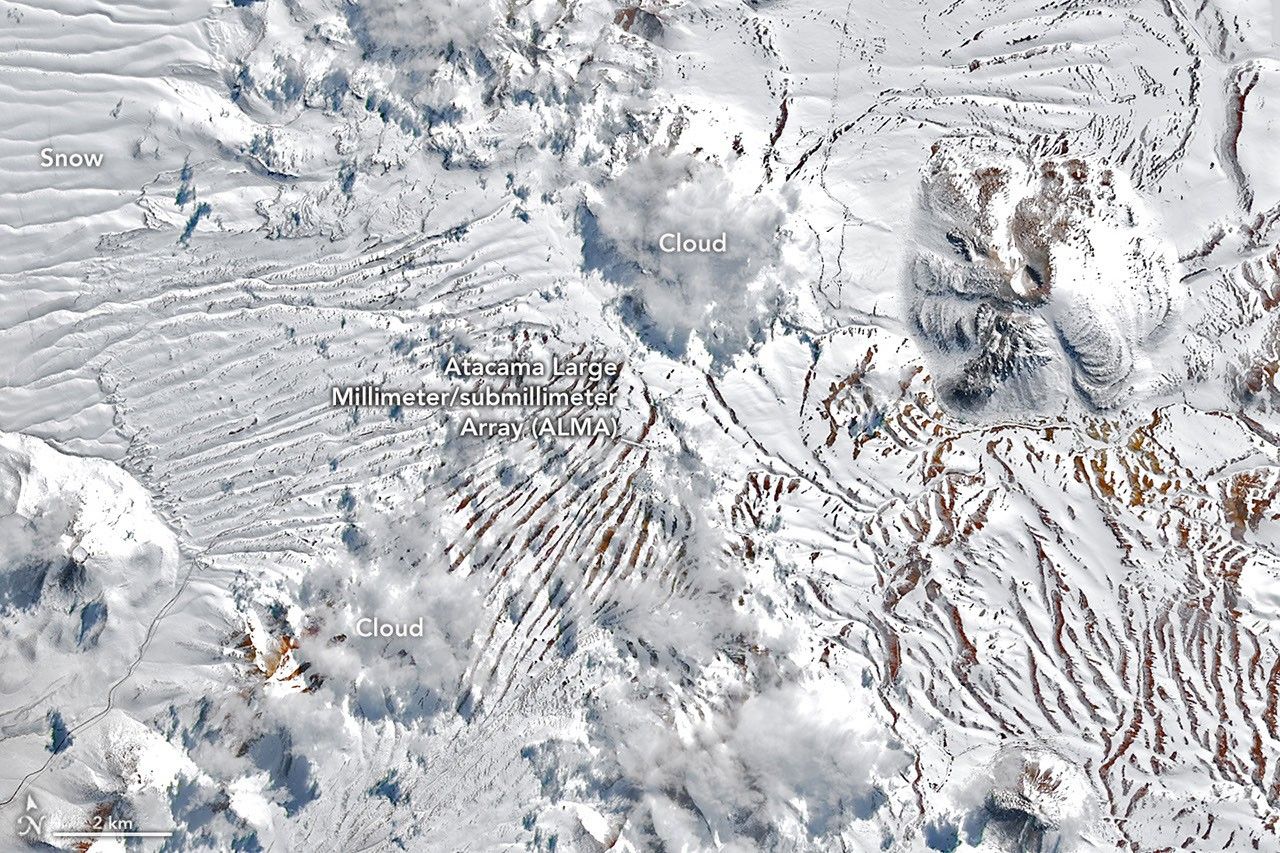
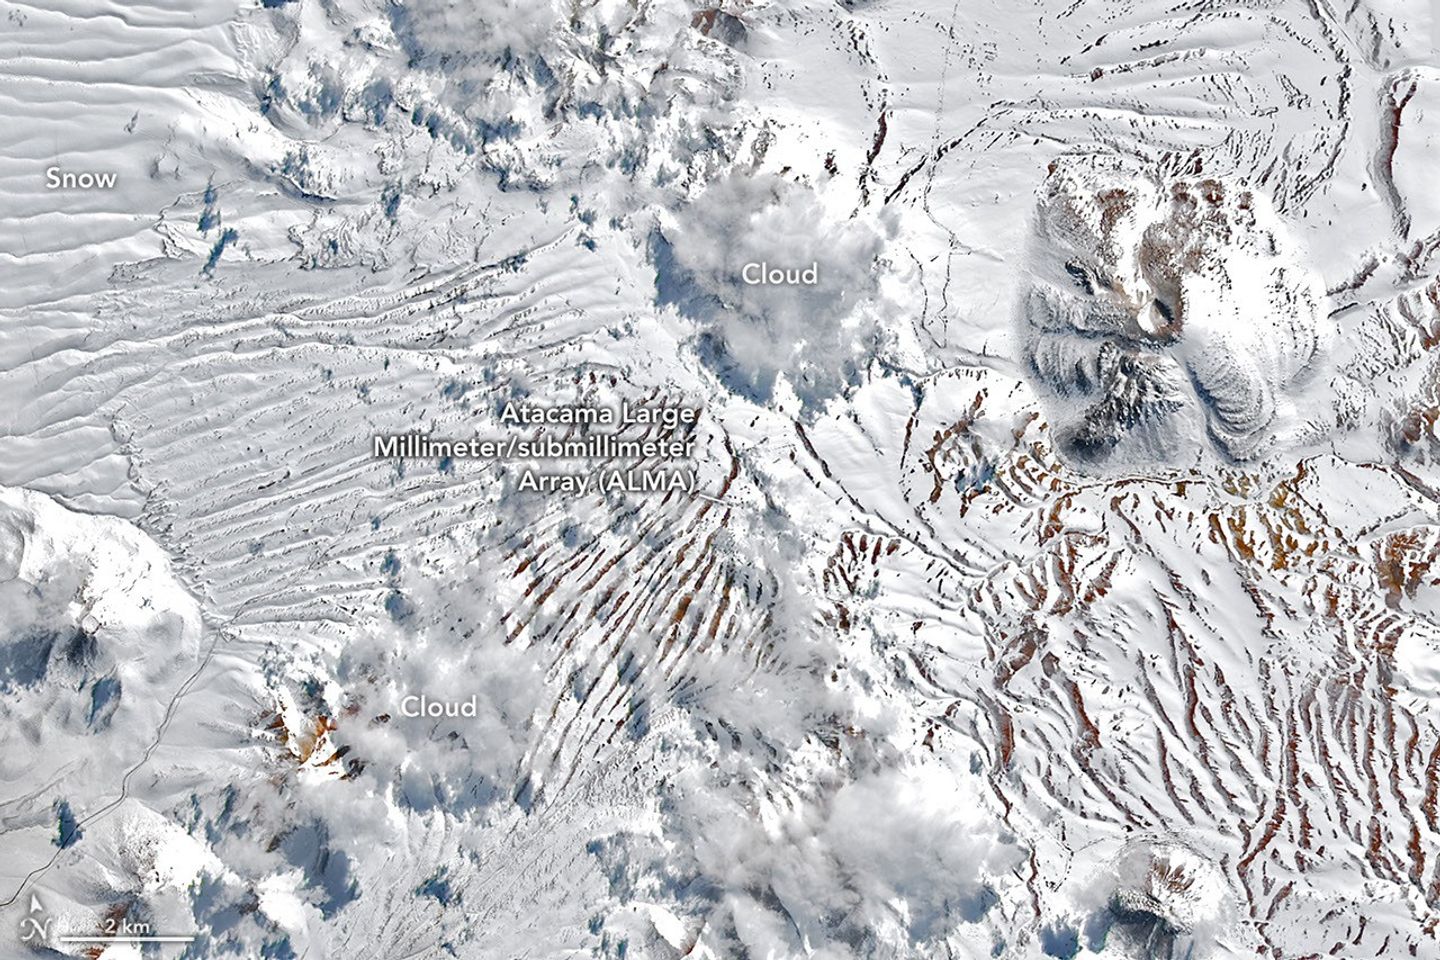
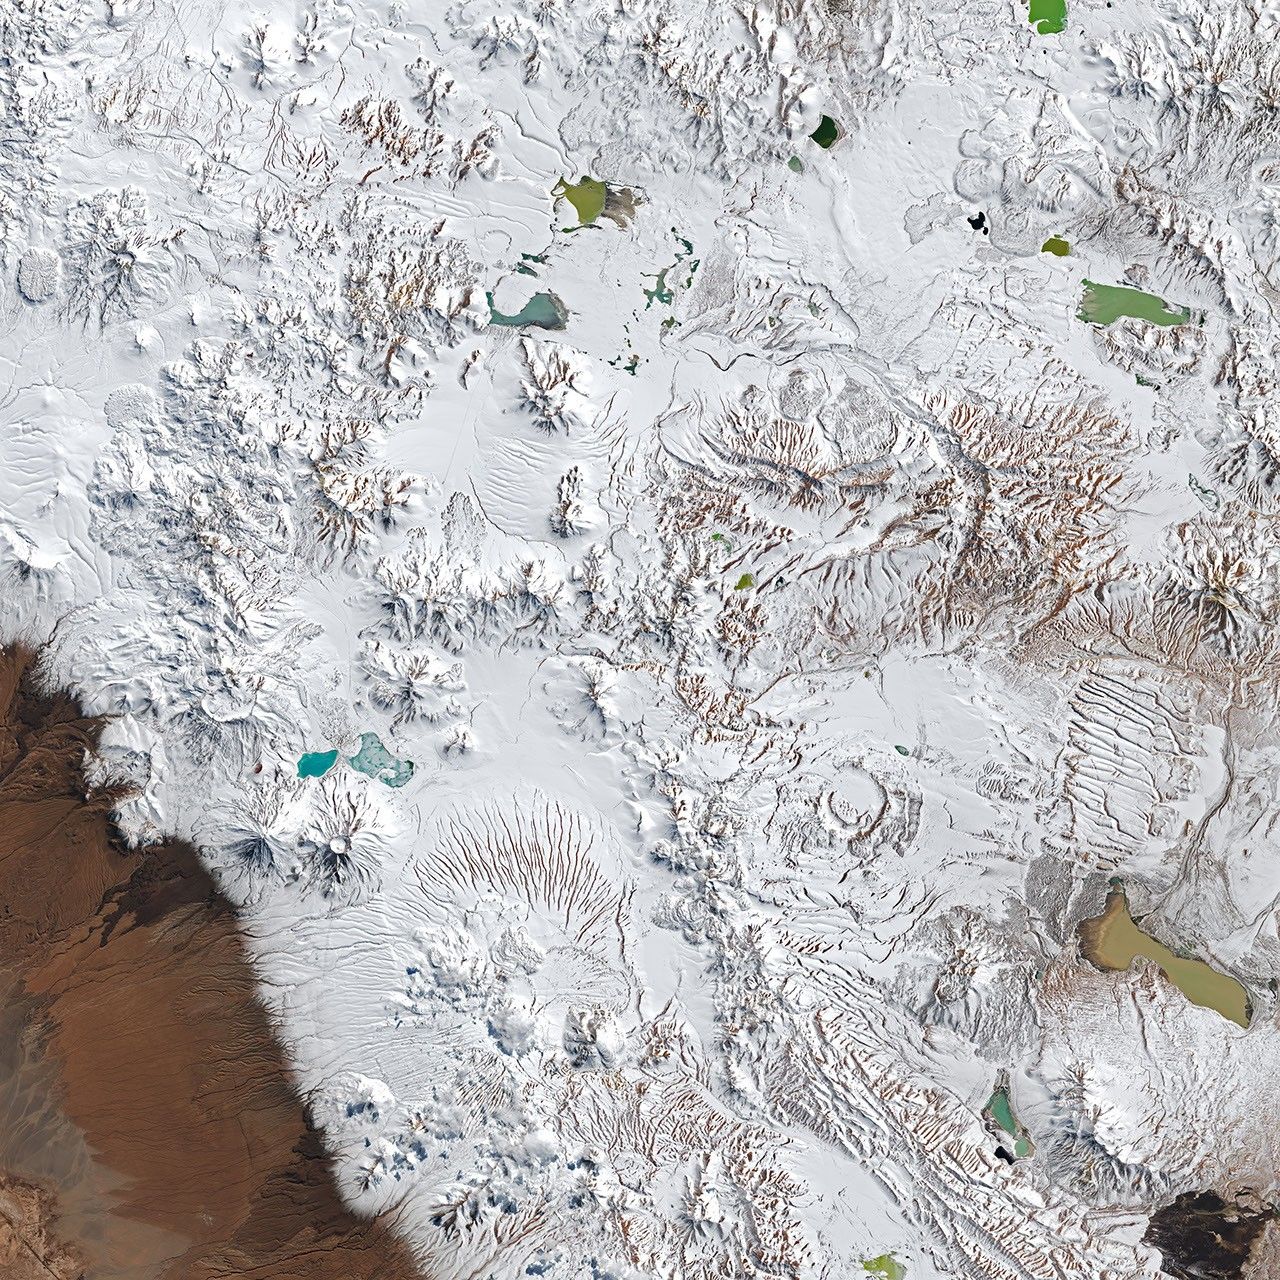
The same plateau is now blanketed in white snow. The location of the radio telescope array is nearly indistinguishable from the surrounding terrain.
NASA Earth Observatory / Lauren Dauphin
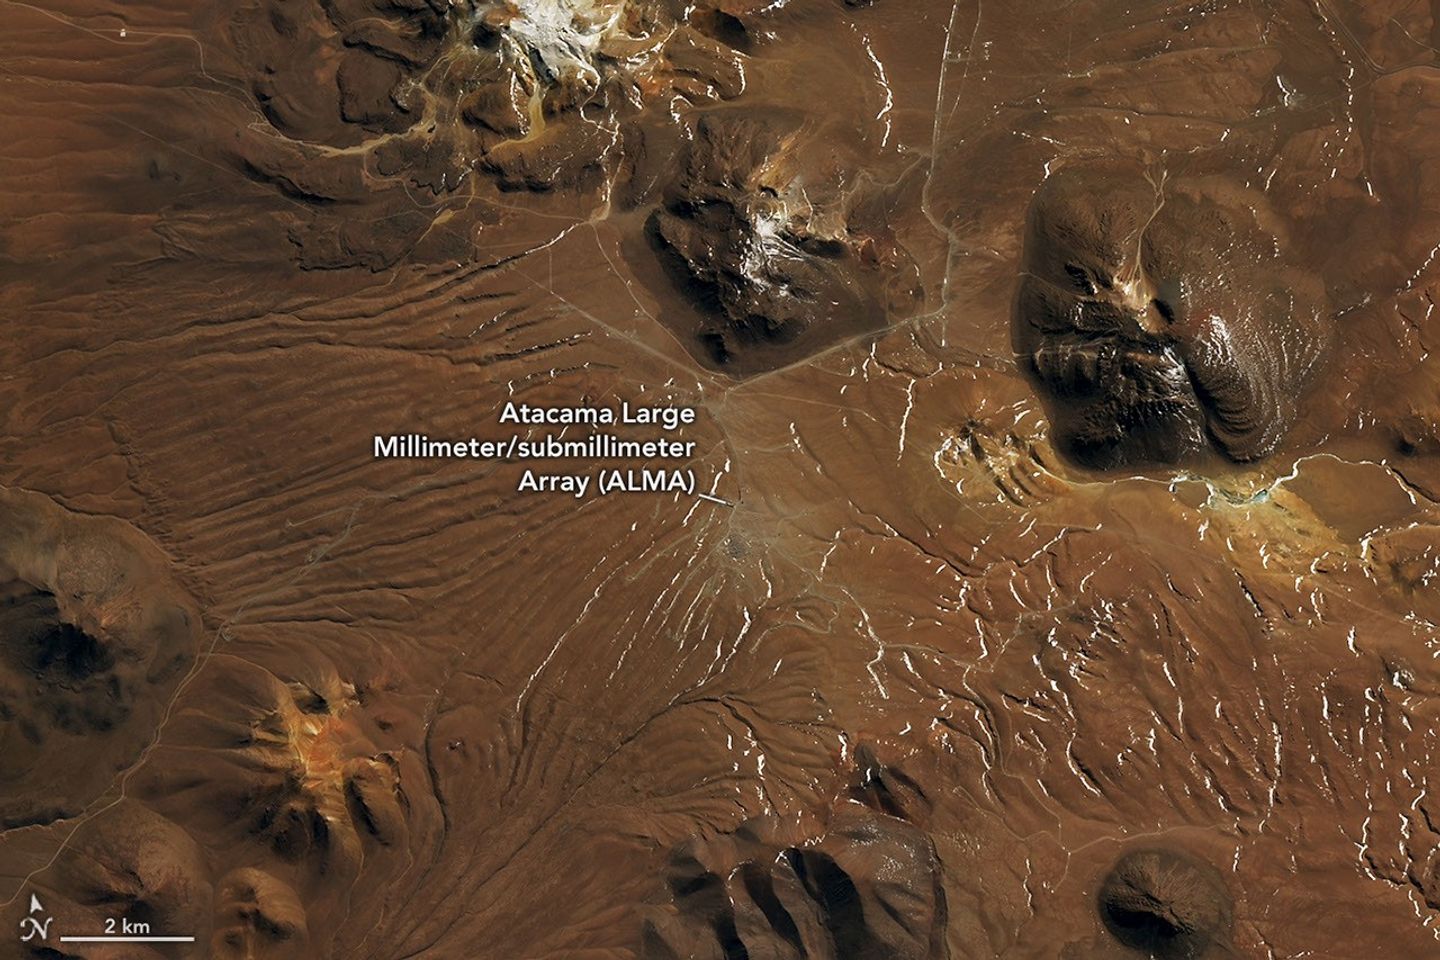
A plateau in the Chilean Andes is surrounded by stratovolcanoes and lava domes. The dry, mostly brown landscape has a lighter brown patch near the center, marking the radio telescope array.
NASA Earth Observatory / Lauren Dauphin
The same plateau is now blanketed in white snow. The location of the radio telescope array is nearly indistinguishable from the surrounding terrain.
NASA Earth Observatory / Lauren Dauphin
August 6, 2026
August 14, 2026
Part of northern Chile transforms from bare to snow-covered in these images captured before and after winter storms in August 2026 by the NASA-USGS Landsat 8 and Landsat 9 satellites. NASA Earth Observatory images by Lauren Dauphin.
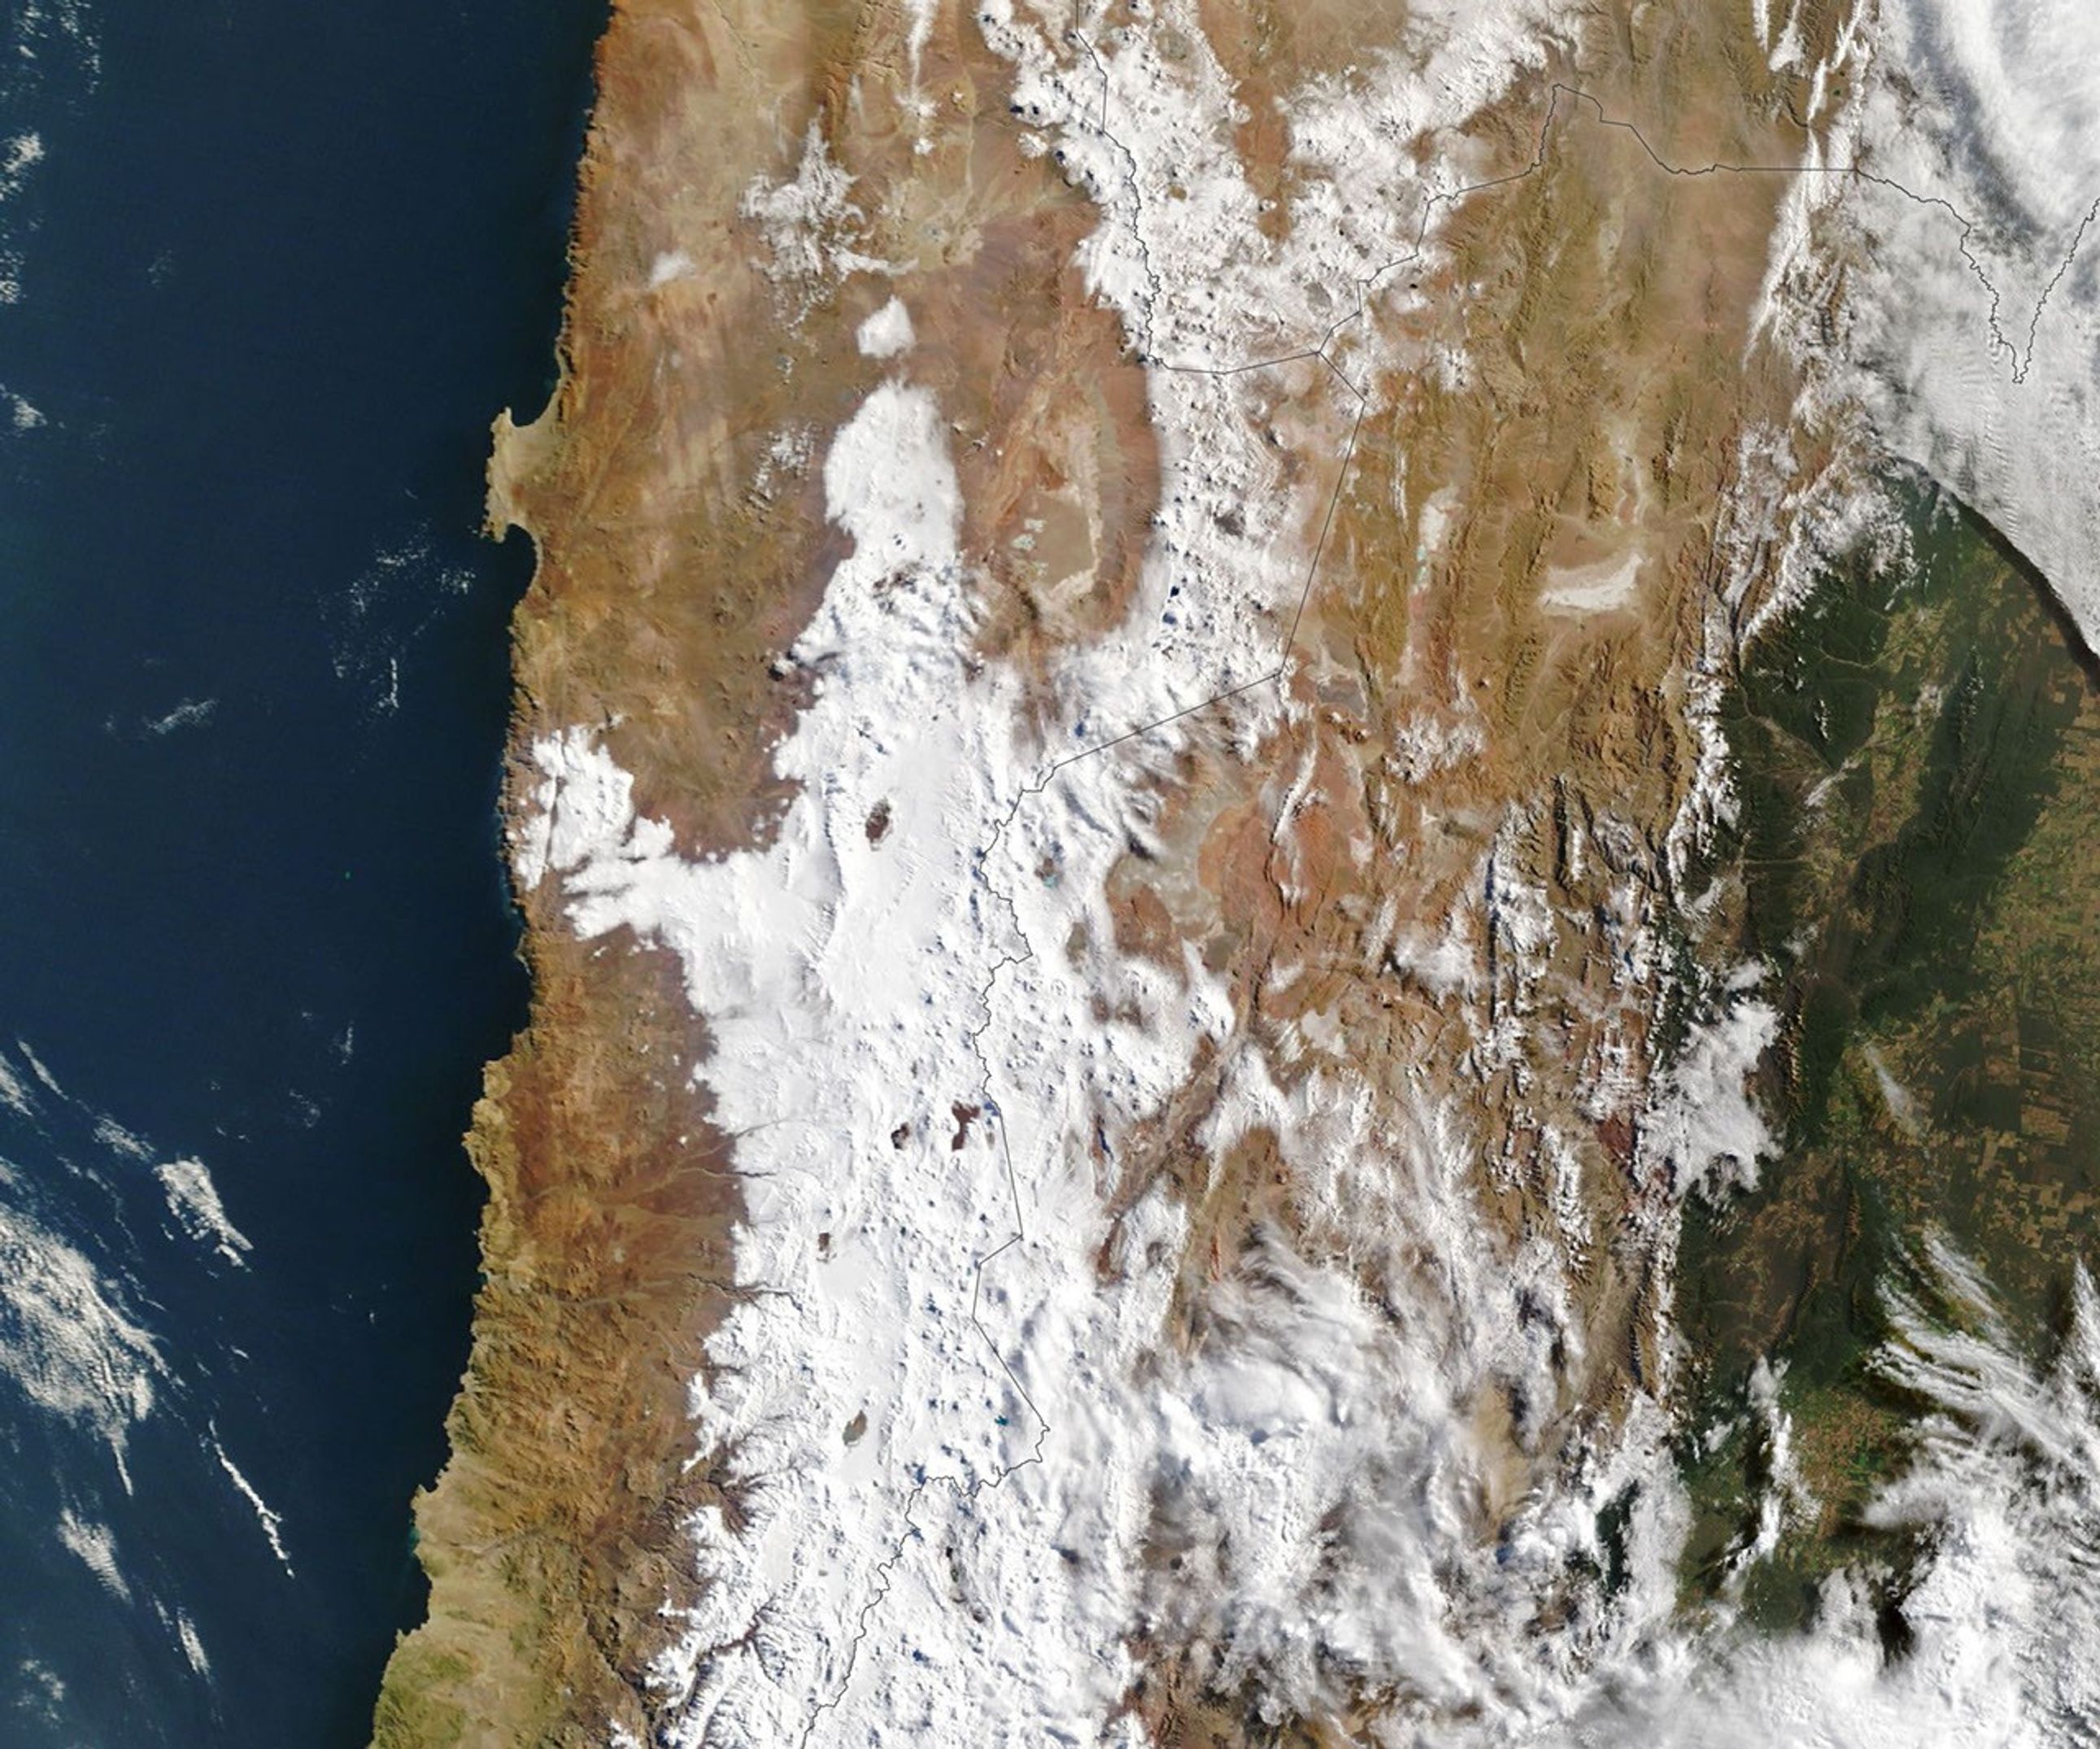
In August 2026, back-to-back winter storms left parts of the Atacama Desert in northern Chile covered in a rare blanket of snow. The typically arid region has seen snowfall before, notably in 2025 and before that in 2011. But one of the 2026 events was unusually widespread, stretching from the Andes to near the Pacific coast.
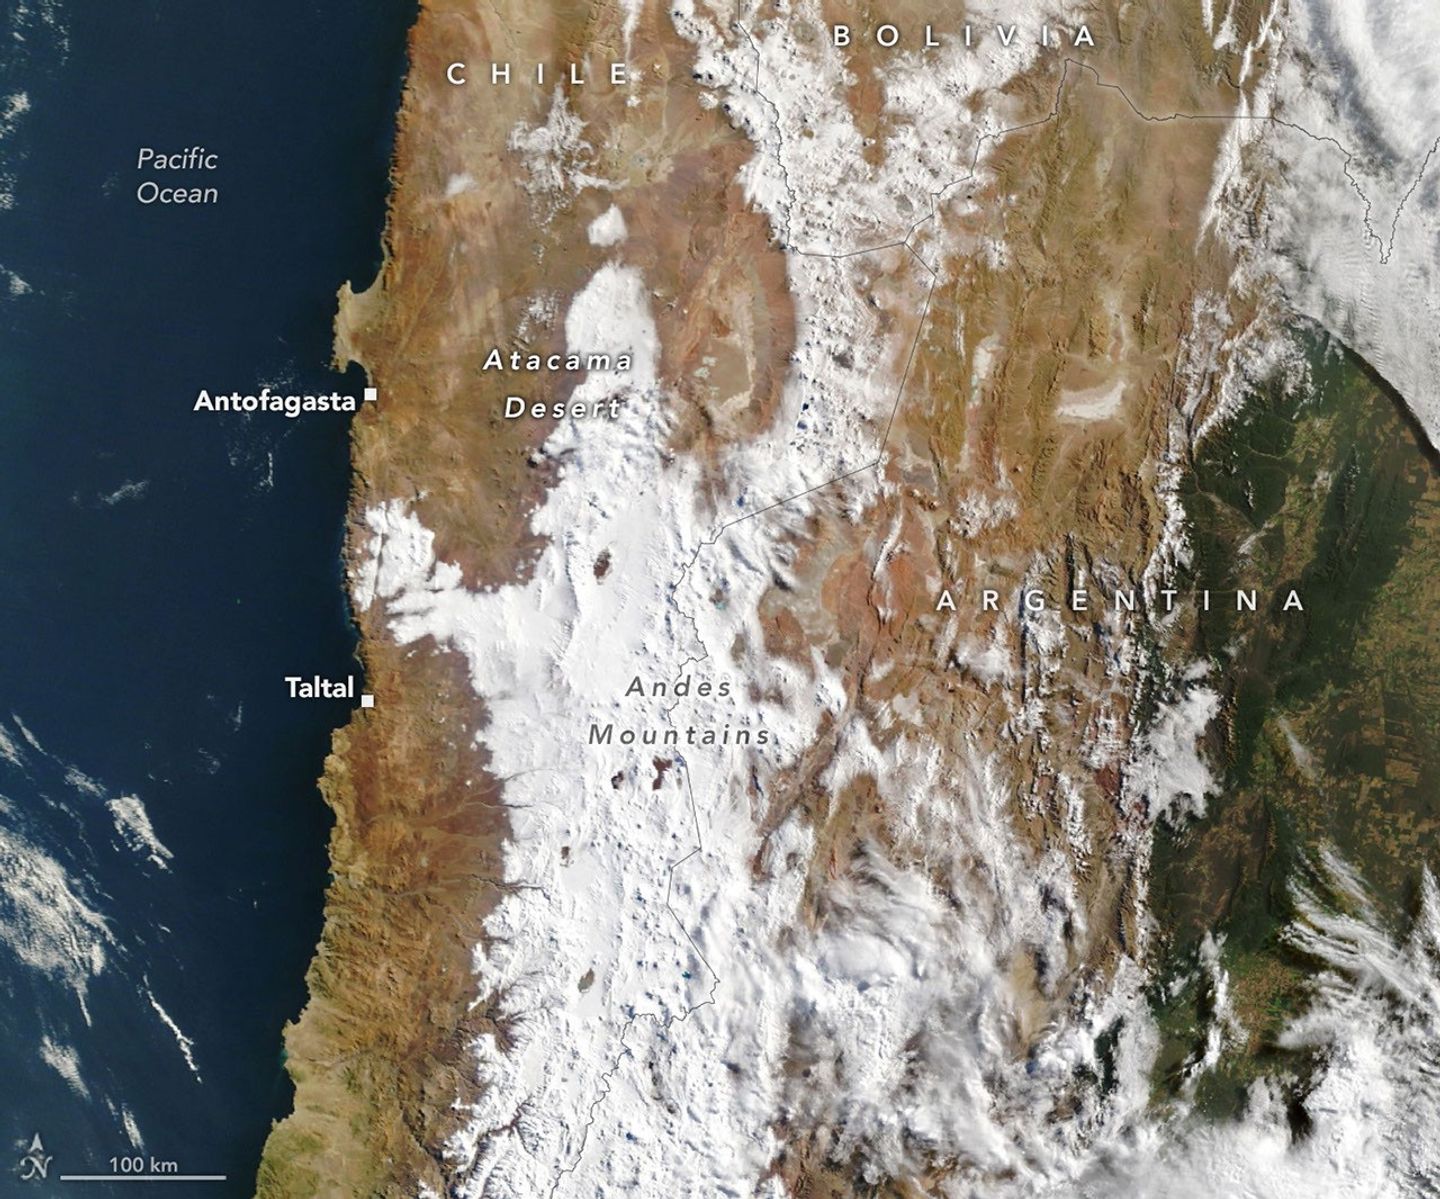
A blanket of snow spans a vast area of northern Chile, from the Andes to near the Pacific coast, captured in this image on August 19, 2026, by the MODIS (Moderate Resolution Imaging Spectroradiometer) on NASA’s Terra satellite.
NASA Earth Observatory/Lauren Dauphin
Another storm in the second half of the month blanketed an even wider area with fresh snowfall. This image, captured by the MODIS (Moderate Resolution Imaging Spectroradiometer) on NASA’s Terra satellite on August 19, shows snow extending westward from the Andes, across the desert’s hyper-arid core, and close to the Pacific coast south of the Chilean port city of Antofagasta. This coastal area is home to several other major astronomical observatories, some of which also suspended operations during the event.
Most of the region’s winter precipitation comes from cutoff lows—low-pressure systems that become cut off from the jet stream and can occasionally reach northern Chile. That’s what happened in 2025, said René Garreaud, an atmospheric scientist at the University of Chile. The late-August 2026 storm also came from a cutoff low, but this one spun off from an unusually large trough—an elongated area of relatively low atmospheric pressure—that spanned an enormous stretch of the hemisphere, from the tip of South America up into the subtropics.
The atmospheric disruption, combined with ample coastal moisture, produced precipitation that spanned an unusually wide swath of the region—offshore, along the coast, across the core of the Atacama, and over the Andes. Totals reached a magnitude “rarely seen in the otherwise extremely arid region,” Garreaud said.
In some areas it fell as rain, not snow. Taltal, for instance, on Chile’s northern coast, accumulated nearly 40 millimeters (1.6 inches) of rain in three days—about 10 times its annual mean, Garreaud said. “We see these kinds of events only a few times, if any, per decade.”
The abundant precipitation spurred destructive mudflows and flash flooding in parts of northern Chile. The National Disaster Prevention and Response Service (SENAPRED) reported thousands were affected and hundreds of homes had major damage.
Garreaud noted that the strengthening El Niño is the backdrop for the anomalously wet winter in north-central Chile. In addition to the August storms, a major event in July brought significant impacts to the country’s Norte Chico region. During El Niño, the subtropical Pacific high—which normally keeps the region dry—weakens, while a blocking high tends to form in the South Pacific near the tip of the continent. Together, these shifts push the Southern Hemisphere storm track equatorward.
Discover the cosmos! Each day a different image or photograph of our fascinating universe is featured, along with a brief explanation written by a professional astronomer.
Nā ʻUhane Māhoe Huki Pū i ke Ola
Explanation:Nā ʻUhane Māhoe Huki Pū i ke Ola, is the Hawaiian name given to this image of a pair of spiral galaxies locked in a mutual gravitational embrace. Some 200 million light-years distant toward the high flying constellation Pegasus their spectacular, galactic scale merger is captured in sharp detail in the image from the 8.1 meter Gemini North telescope on Maunakea, Hawai‘i. The galaxy pair, known as NGC 7253 and Arp 278, was chosen as a target, researched, and given an Hawaiian name by high school students in the joint Gemini Observatory and University of Hawaiʻi Project Hōkūlani internship program. The name translates to “The Twin Spirits Pulling Together Creating Life”. That’s both culturally and astronomically appropriate for galaxy collisions that trigger a cosmic maelstrom of star formation from galactic reservoirs of elemental building blocks of life. These merging galaxies are found within a region of Pegasus identified as the Hawaiian navigational constellation Ka Lupe o Kawelo.
Image Credit:International Gemini Observatory / NOIRLab/NSF/AURA Image Processing: J. Miller & M. Rodriguez (International Gemini Observatory/NSF NOIRLab), T.A. Rector (University of Alaska Anchorage/NSF NOIRLab), D. de Martin & M. Zamani (NSF NOIRLab)
Authors & editors:
Jerry Bonnell, Cecilia Chirenti, Robert Nemiroff, Keighley Rockcliffe
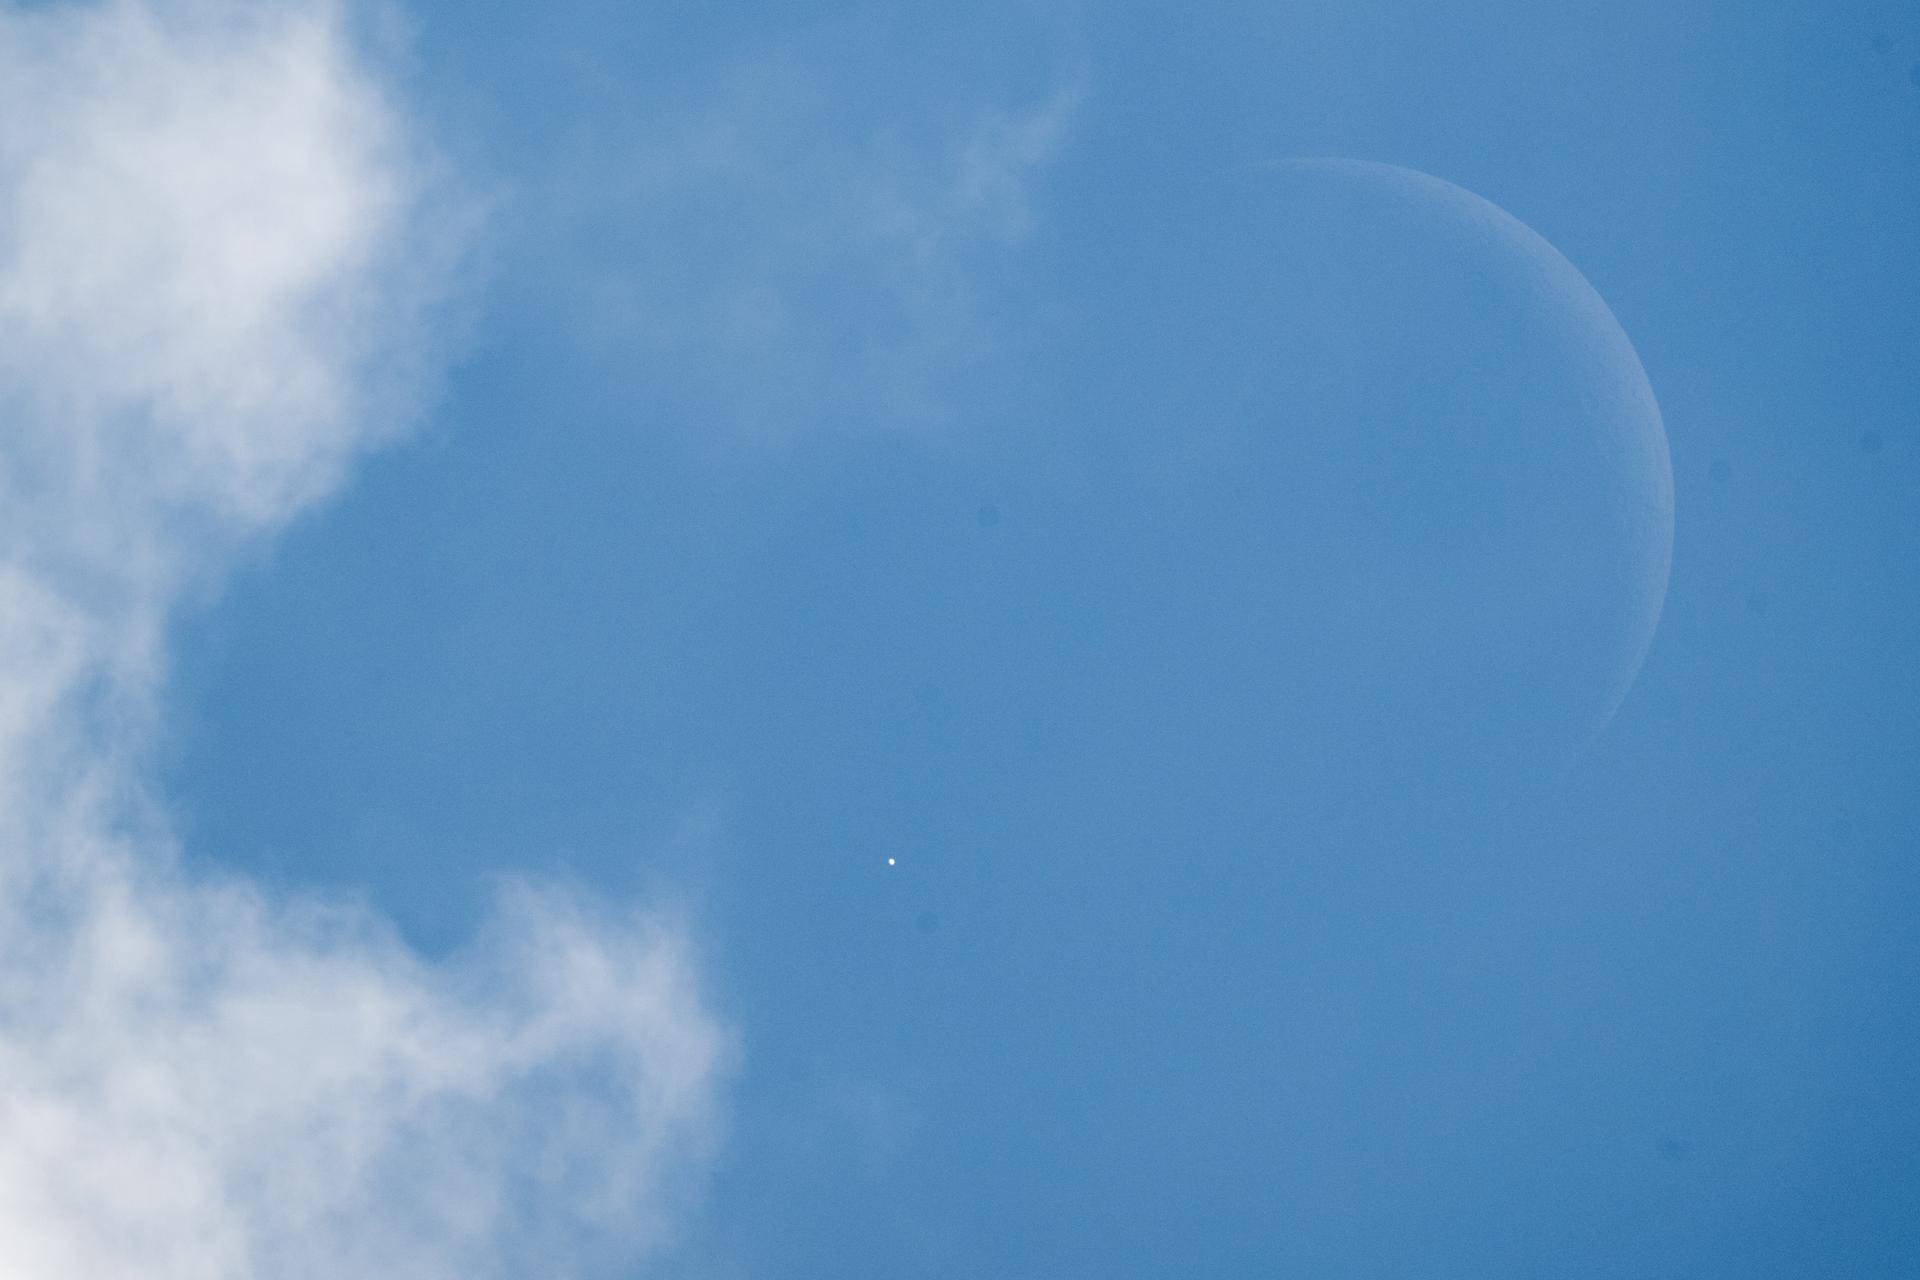
Venus is seen as it disappears behind the Moon at the start of the occultation on June 17, 2026, from the Mary W. Jackson NASA Headquarters building in Washington
NASA/Joel Kowsky
On Wednesday, June 17, skywatchers across the United States—and parts of Canada—enjoyed a rare event: a daytime lunar occultation of Venus. A lunar occultation occurs when the Moon moves directly in front of another celestial object from our viewpoint on Earth, briefly hiding it from sight.
This time, the Moon slipped in front of Venus for the first of three occultations happening this year, creating a striking daylight moment for those who caught it. If you missed it, there will be two more opportunities to see Venus disappear behind the Moon in 2026: Sept. 14, visible from parts of Asia, Africa, Europe, and western Russia; and Nov. 7, visible from southern South America.
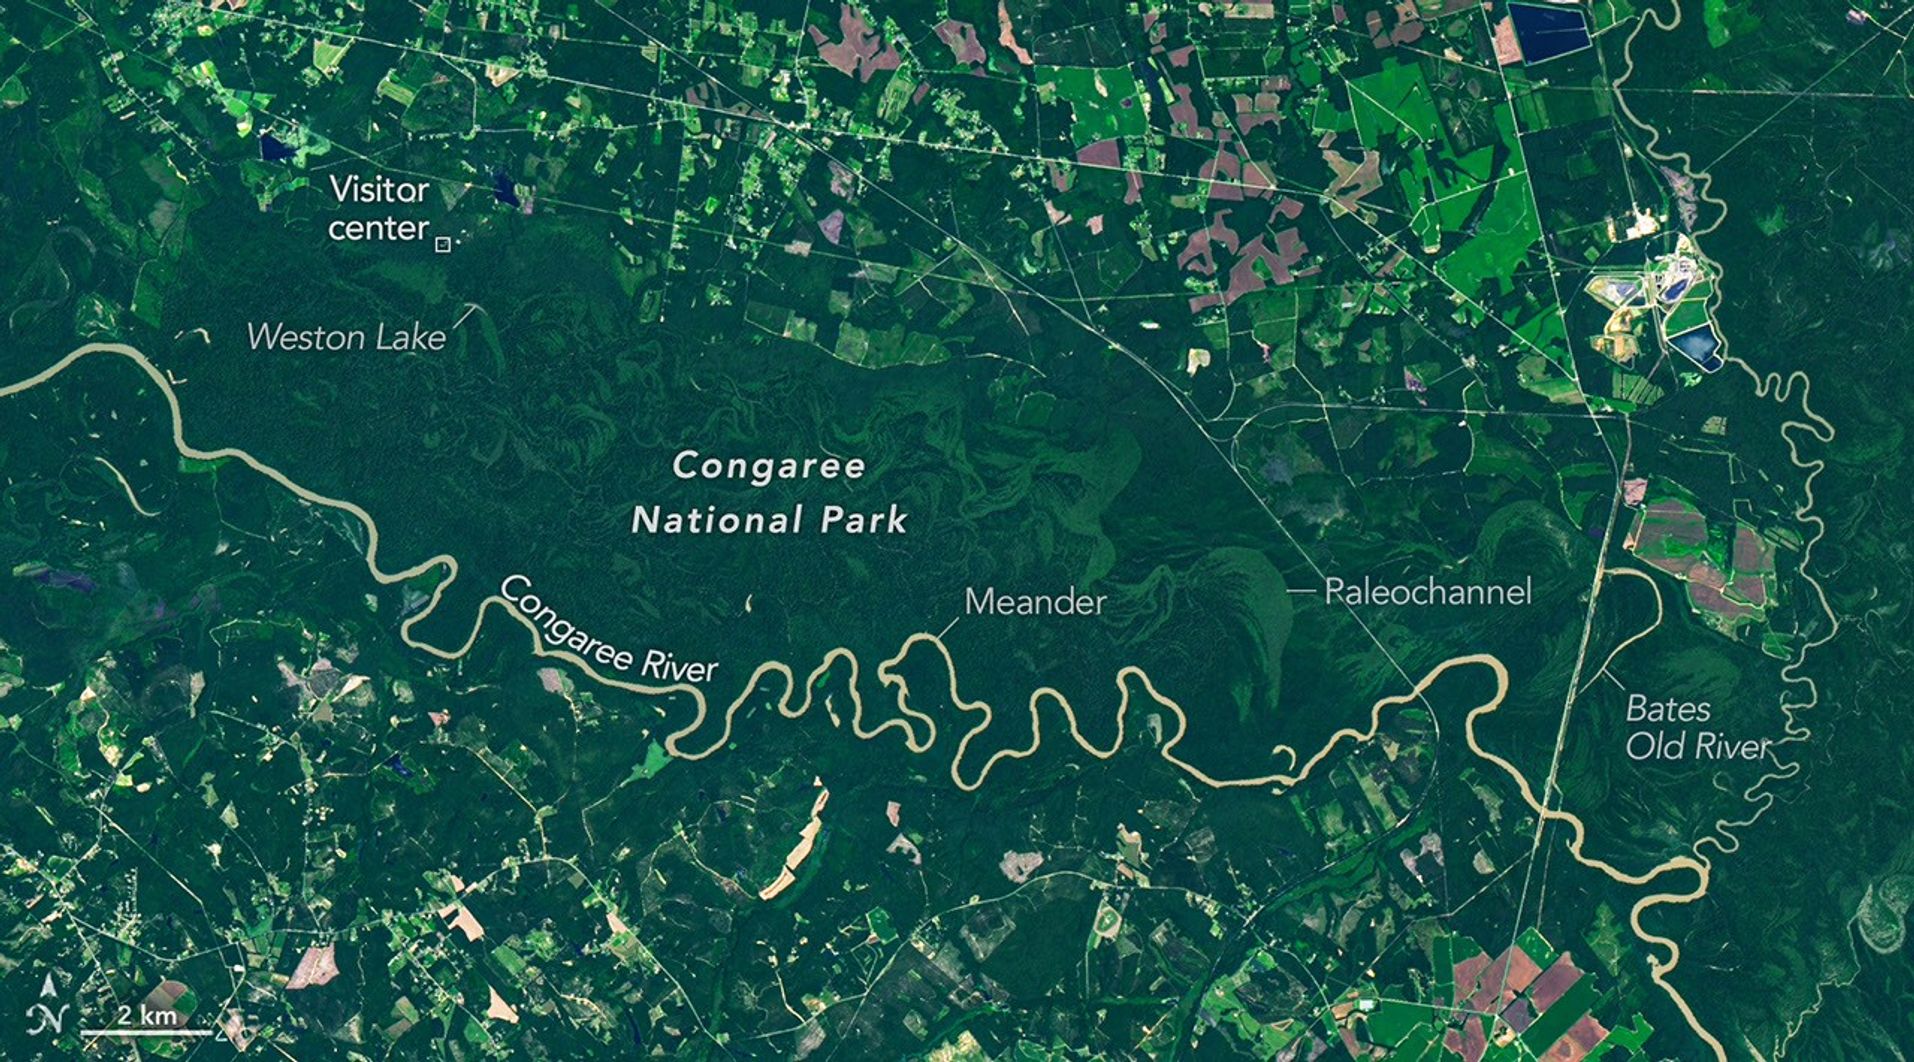
The OLI on Landsat 9 captured this image of the Congaree River winding through floodplain forests in Congaree National Park on August 18, 2025.
NASA Earth Observatory/Michala Garrison
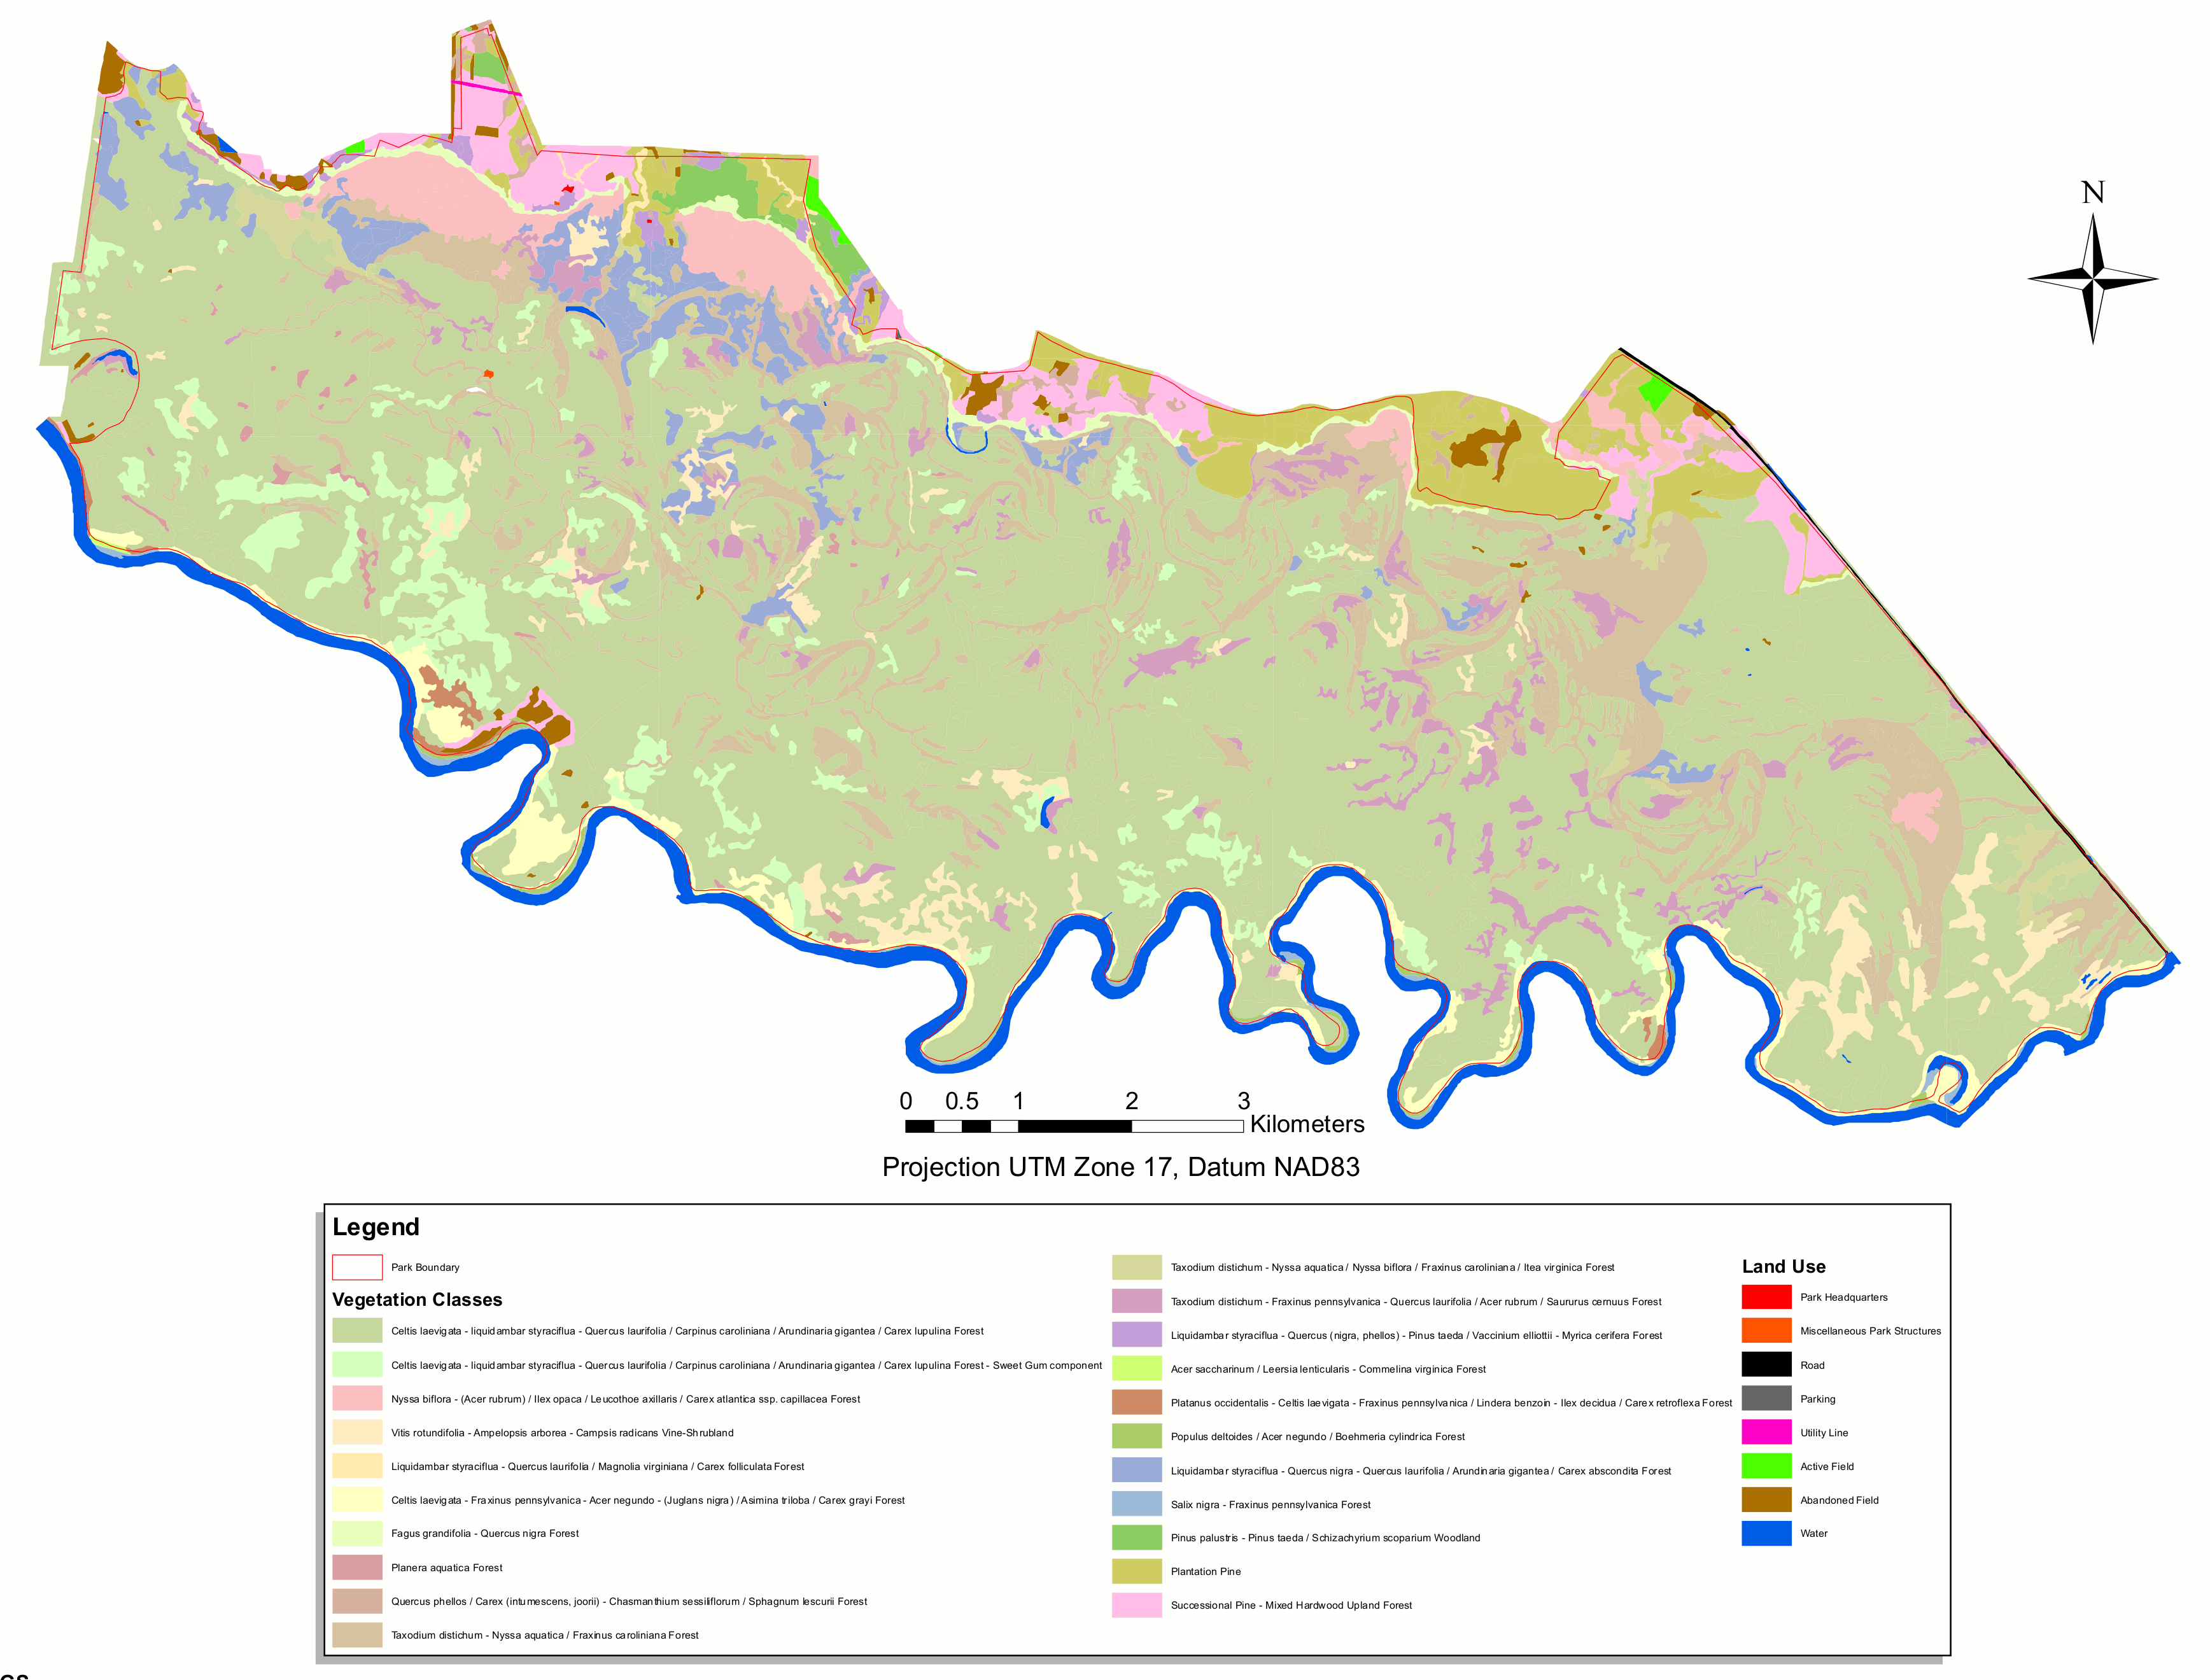
Among the 63 U.S. national parks, few are as defined by a single river’s floodplain as Congaree National Park in South Carolina. While the features are also prominent in other parks, a full 80 percent of Congaree National Park lies within the Congaree River floodplain.
It’s a place home to one of the largest intact tracts of old-growth bottomland hardwood forests in the United States. In this image captured by the OLI (Operational Land Imager) on Landsat 9, the river winds through the forested plain, along with curving bands of green that trace old channels, ridges, and swales left behind as the river gradually migrated across it. Slight differences in elevation in these paleochannels and other landforms affect how frequently they flood, producing distinct ecosystems that appear in contrasting shades of green.
The river flows through flat, soft terrain, which encourages the formation of bends and meanders. Water typically flows faster on the outside of bends, leading to more rapid erosion as the channel carves into the outer riverbank. It moves more slowly on the inside of bends, resulting in the deposition of sediment and the growth of sandy features called point bars. Over time, this process can cut off a bend from the main river channel, forming U-shaped oxbow lakes.
The National Park Service lists Weston Lake, 1.2 miles (1.9 kilometers) from the visitor center, as one of the park’s most permanent oxbow lakes, noting that it is relatively deep and lacks the shallow clay and silt layer found in most of the park’s other oxbow lakes, such as Devil’s Elbow. On the right side of the image is Bates Old River, a roughly 4-mile-long abandoned channel of the Congaree River and one of the longest oxbow lakes in South Carolina. Over time, abandoned channels and oxbow lakes can fill with sediment and become shallow wetlands. Some of these low-lying, water-filled features are known as sloughs, where flood-tolerant cypress-tupelo forests tend to grow.
While loggers targeted forests along the Congaree in the 1880s, challenges such as frequent flooding, interminably muddy roads, and mosquito-plagued conditions meant that most of the floodplain forests escaped the widespread logging that transformed other parts of the Southeast. By the 1950s, conservationists had begun to recognize how rare old-growth forests of this type had become in the region. Congress designated the area a national monument in 1976, and it became a national park in 2003.
As the river snakes its way through the park’s mostly flat terrain, it overflows its banks several times per year, usually in the winter and early spring but also in the summer and fall after hurricanes and major rainstorms. These floods distribute broad layers of nutrient-rich silt throughout the floodplain, nourishing the forests and contributing to the high concentration of unusually large trees in the park.
Over the decades, Congaree National Park has harbored a remarkable array of giant “champion” trees that have held national and state size records for their species. Though individual trees have gained and lost champion status as they have been damaged, have died, or been surpassed by newly measured trees elsewhere, Congaree trees such as the possumhaw (Ilex decidua), water hickory (Carya aquatica), loblolly pine (Pinus taeda), laurel oak (Quercus laurifolia), swamp tupelo (Nyssa biflora), and sweetgum (Liquidambar styraciflua) have held records at times.
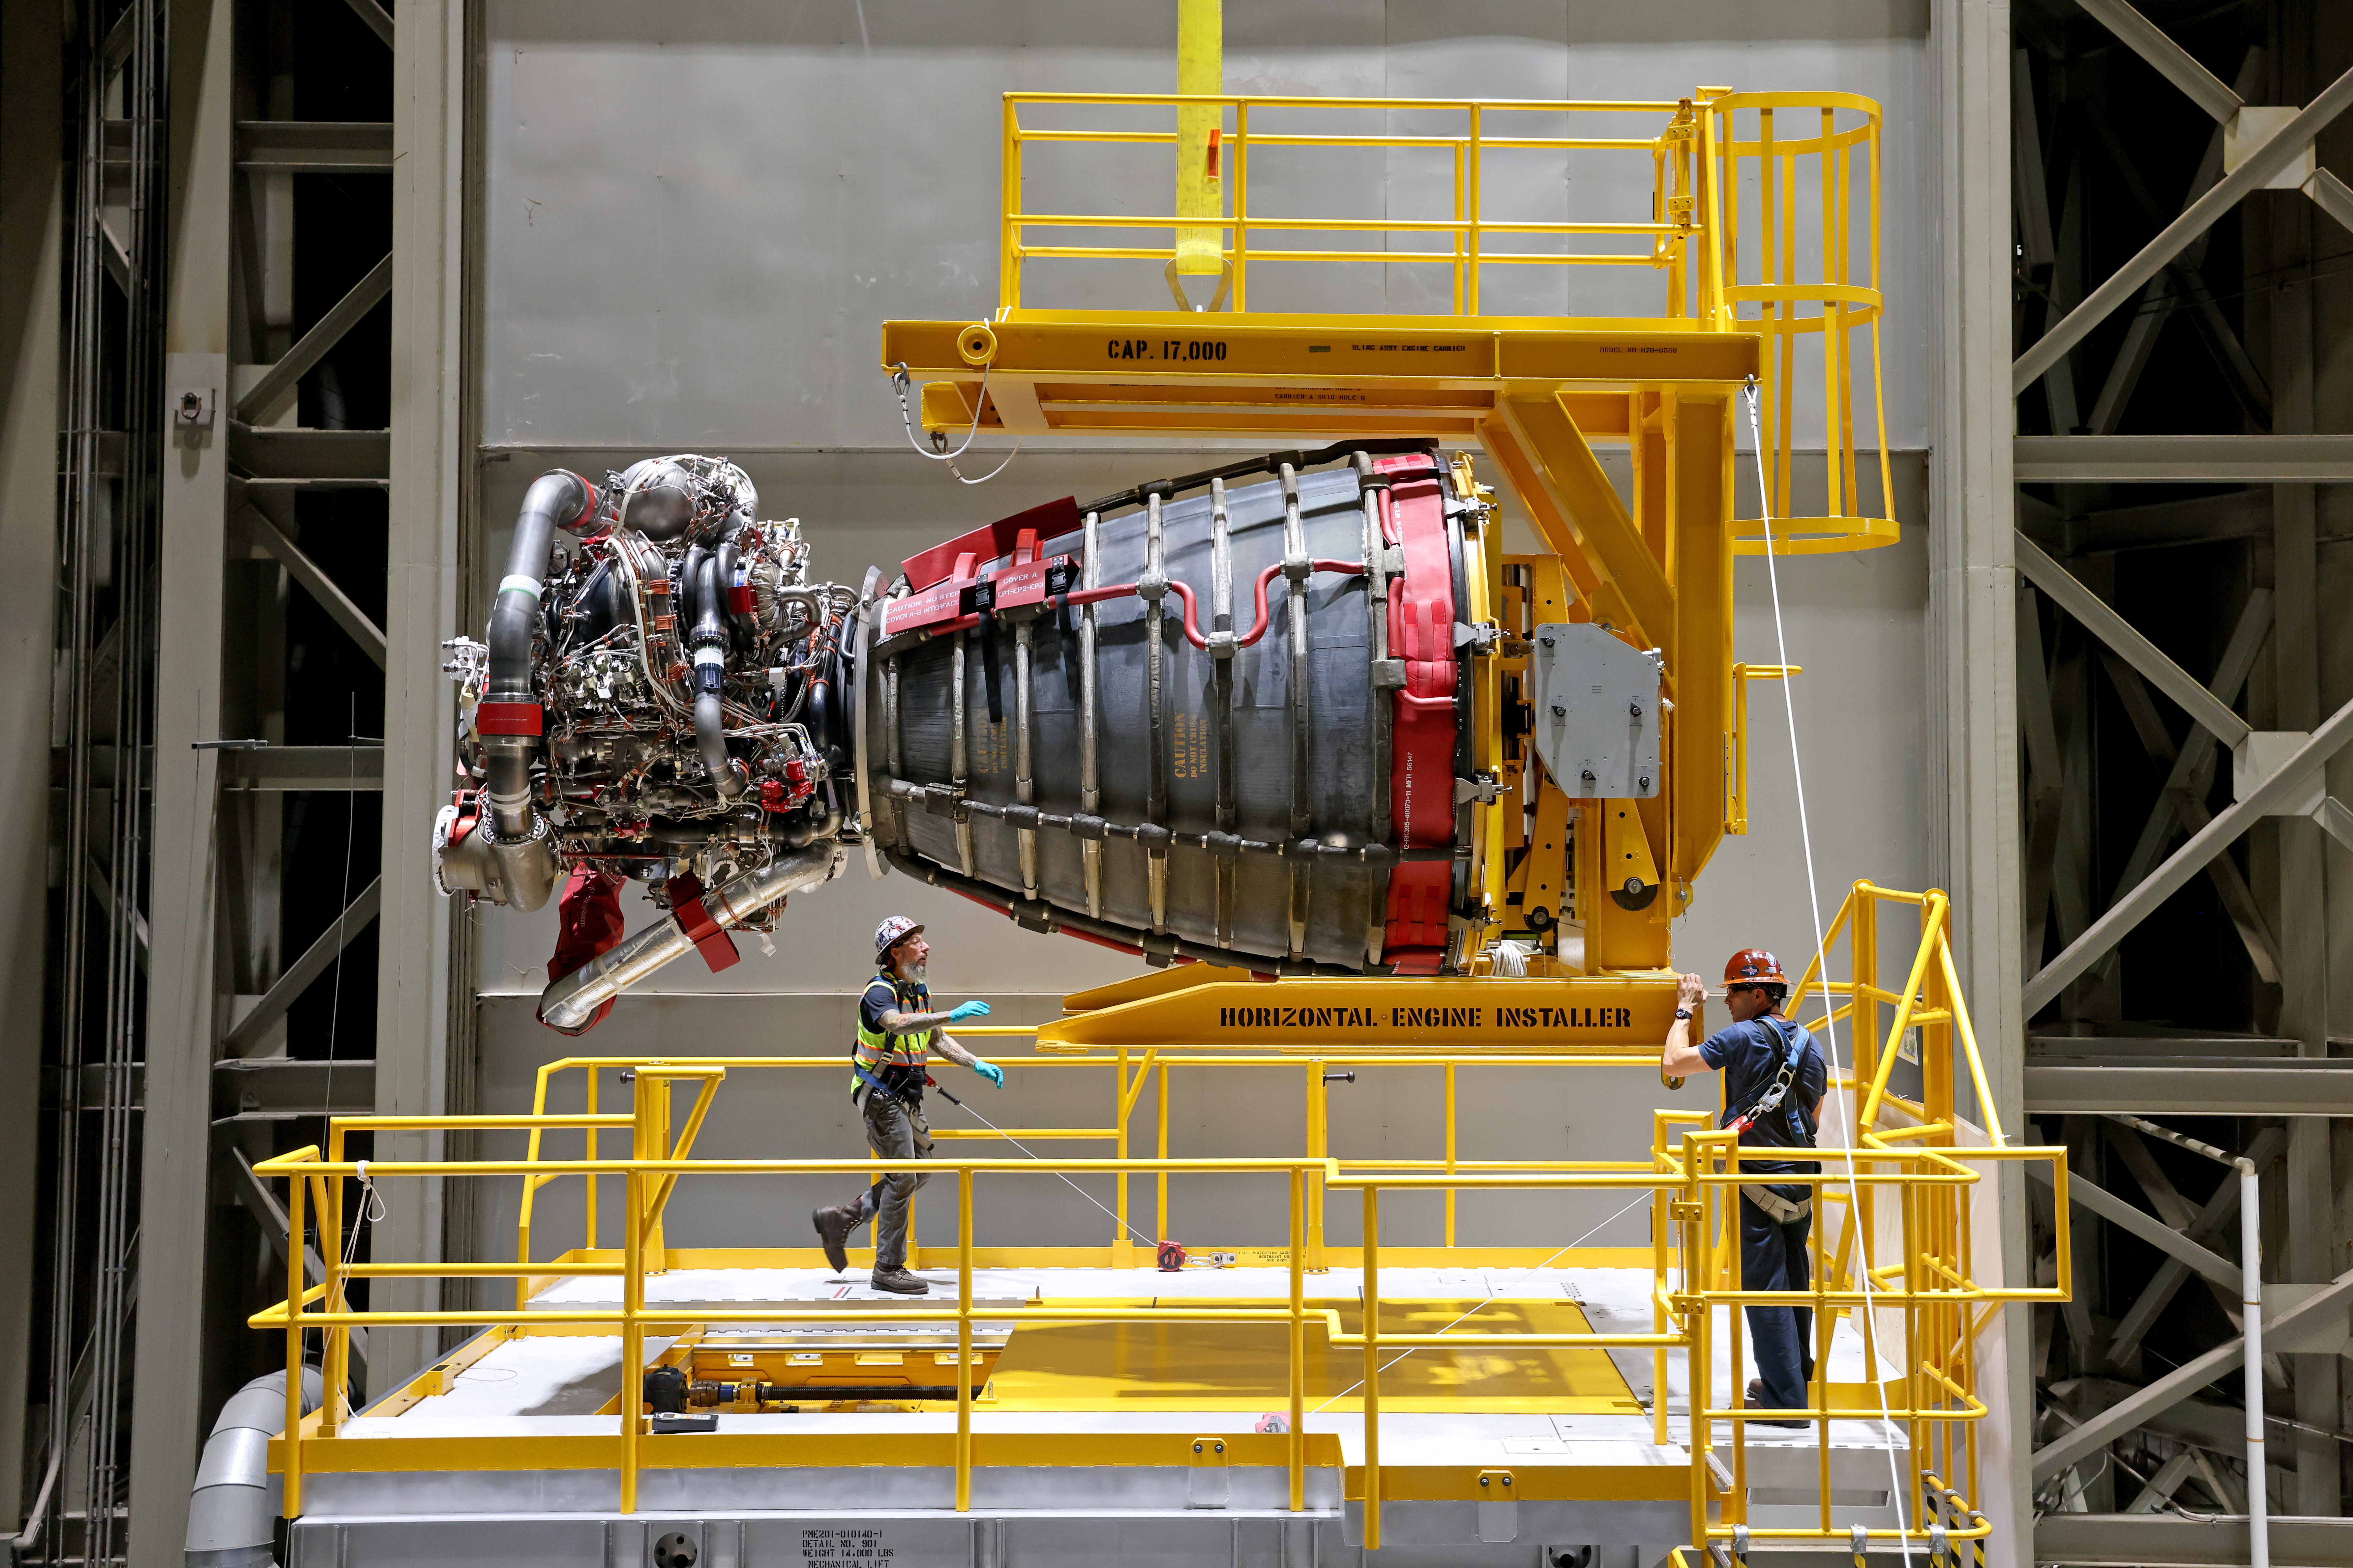
Two technicians at NASA’s Michoud Assembly Facility in New Orleans stand around one of the four RS-25 engines for the agency’s SLS (Space Launch System) rocket on Sept. 8, 2023. The RS-25 engine looks like a bell-shaped nozzle attached to a network of pipes. The engine is being lifted by the horizontal engine installer so it appears to be lying on its side. The RS-25 engine is about the size of a large pickup truck. The technicians are wearing hard hats and safety harnesses.
Credit: NASA/Michael Democker
NASA will host a virtual webinar at 2 p.m. EDT on Friday, Oct. 2, titled “The RS-25 Engine and the Future of Artemis Missions: An Accessible Webinar for the Blind and Low-Vision Community.” This webinar is open to the public, however it is tailored specifically for a blind and low-vision audience.
The webinar will last about two hours and include an audio-described video of an RS-25 engine test, a Q&A session with an Artemis engineer, and a panel about accessibility in space and science. The event will be hosted on the Zoom platform.
Participants in the session include:
Dr. Kimberly Arcand, visualization scientist, NASA’s Chandra X-ray Observatory
Josh Greiner, test director, NASA’s Stennis Space Center in Bay St. Louis, Mississippi
Dr. Craig Moore, materials engineer, NASA’s Marshall Space Flight Center in Huntsville, Alabama
Dr. Robert Shelton, lead simulation engineer, NASA’s Johnson Space Center in Houston
Christine Malec, freelance writer and consultant
Those interested in attending the webinar must RSVP using this form by Friday, Sept. 25. Any questions can be directed to [email protected]. The details of the webinar will be emailed to registrants in the days leading up to the event.
NASA’s Artemis program will send astronauts on increasingly difficult missions to explore the Moon and establish a Moon Base on the lunar surface. For additional information on the Artemis missions, visit:
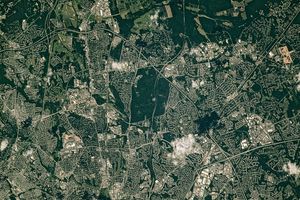
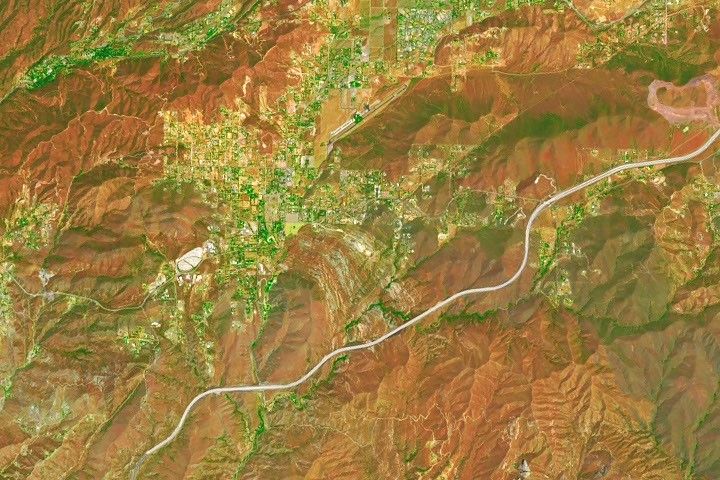
Every month, NASA Earth Observatory features a puzzling satellite image. The September 2026 puzzler appears above.
Your Challenge Identify the location shown in this satellite image. Share what clues you see, where you think it is, and what makes this place interesting or unique to you.
How to Answer Submit your response using this form and select “Puzzler Answer” as the topic. Please include your preferred name or alias.
You can keep it simple and just guess the location. Want to impress us? Tell us which satellite and instrument captured the image, which spectral bands were used, or point out a subtle detail about the geology or history of the area. If something catches your eye, or if this is your home or means something to you, we’d love to hear about it.
The Prize We can’t offer prize money or a trip to space to see Earth like satellites and astronauts do. But we can offer something almost as rewarding: puzzler bragging rights.
About a week after the challenge, we’ll post the answer at the top of this page, along with a link to an Earth Observatory Image of the Day story that explains the image in more detail. We’ll recognize the first person who correctly guesses the location, and we may also highlight readers who share especially thoughtful or interesting answers. By submitting a response, you acknowledge that your comments may be edited, excerpted, and published on this page.
Until then, zoom in, look closely, and enjoy the challenge. See you at the reveal!
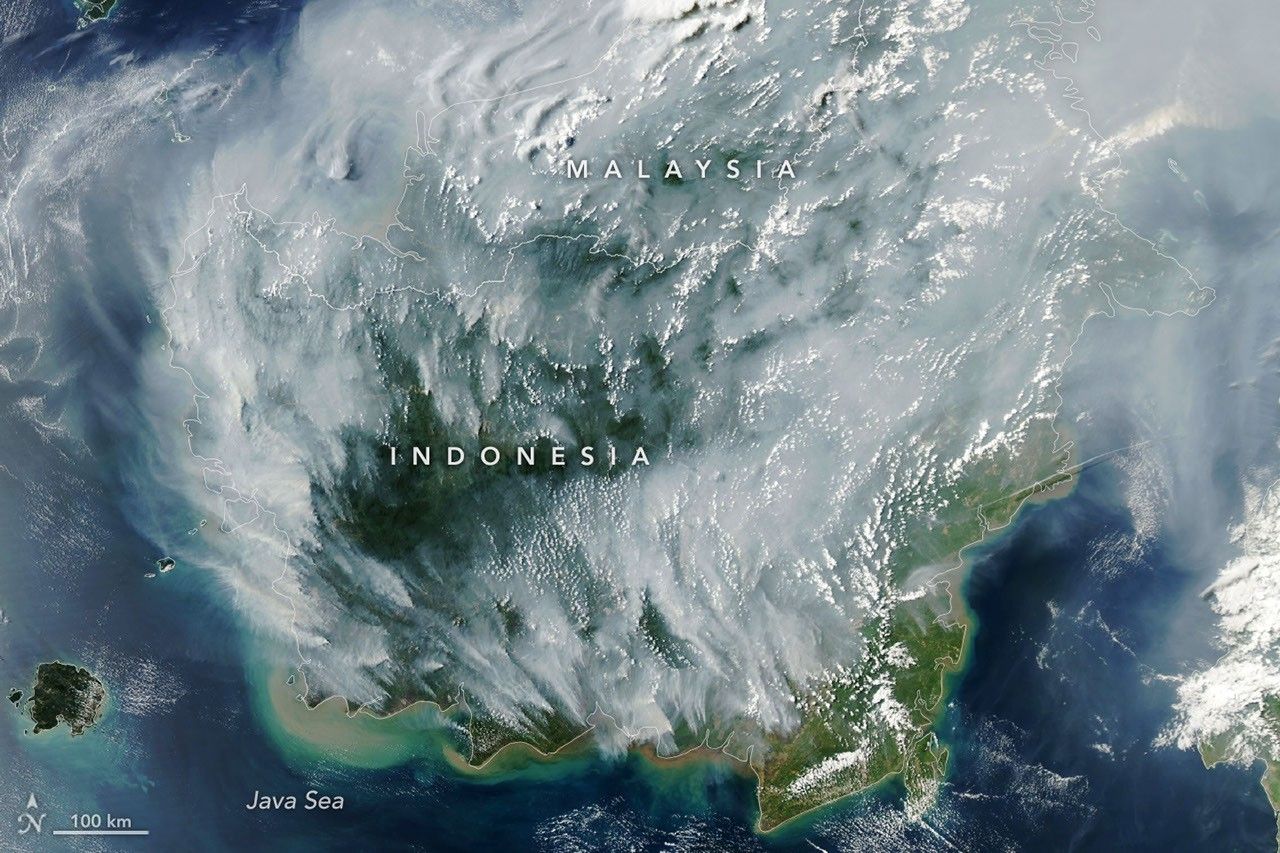
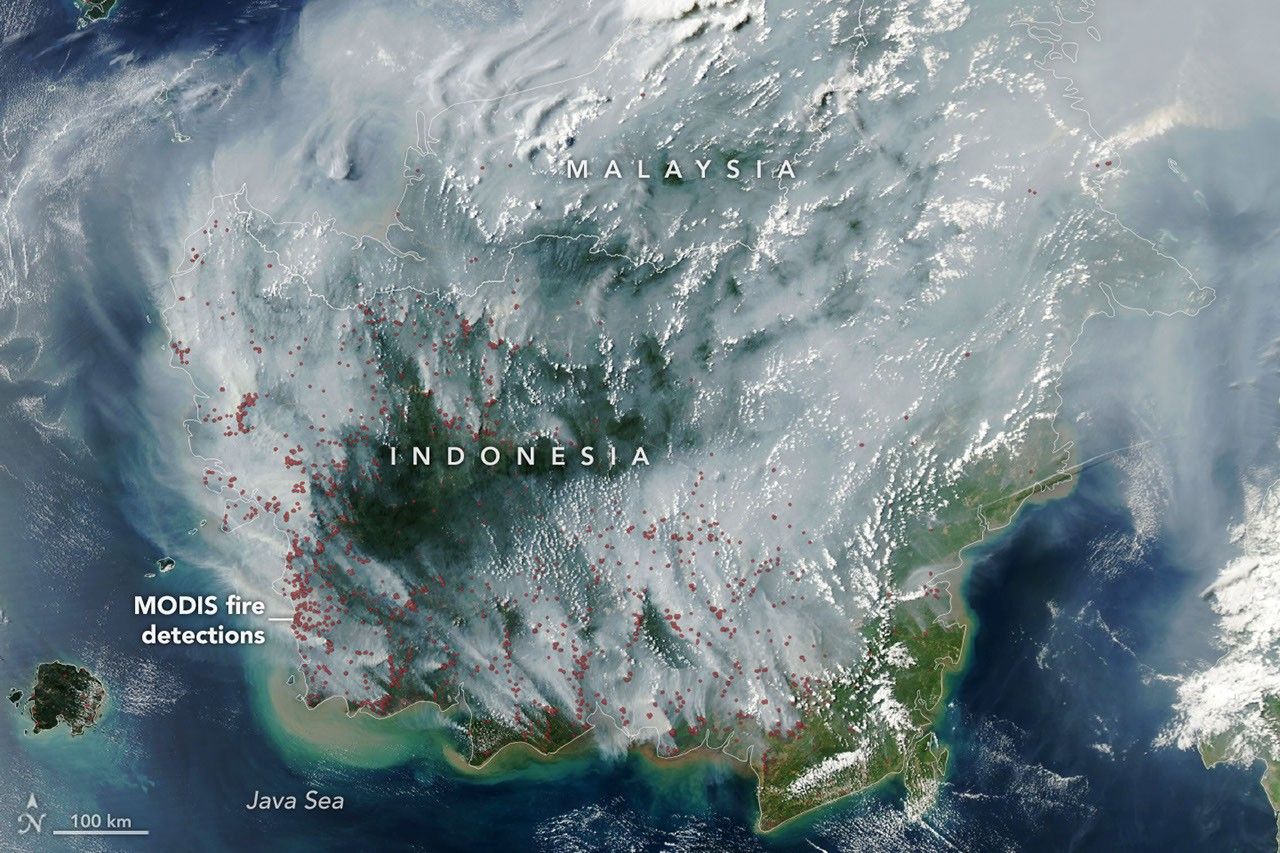
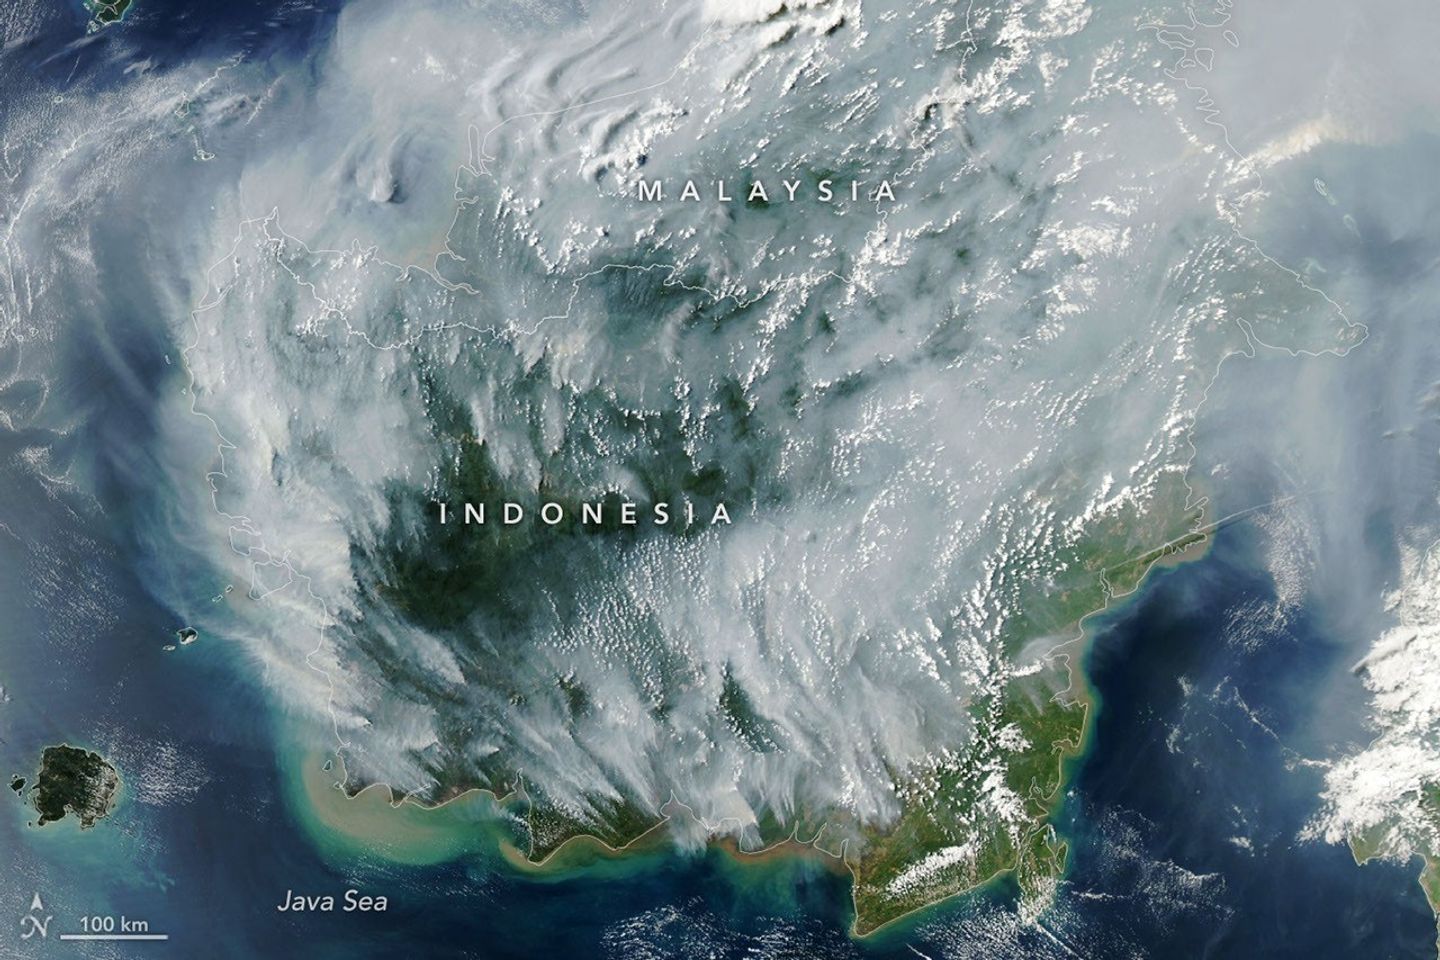
Thick gray plumes of smoke stream from large numbers of fires scattered across the island of Borneo.
NASA Earth Observatory / Lauren Dauphin
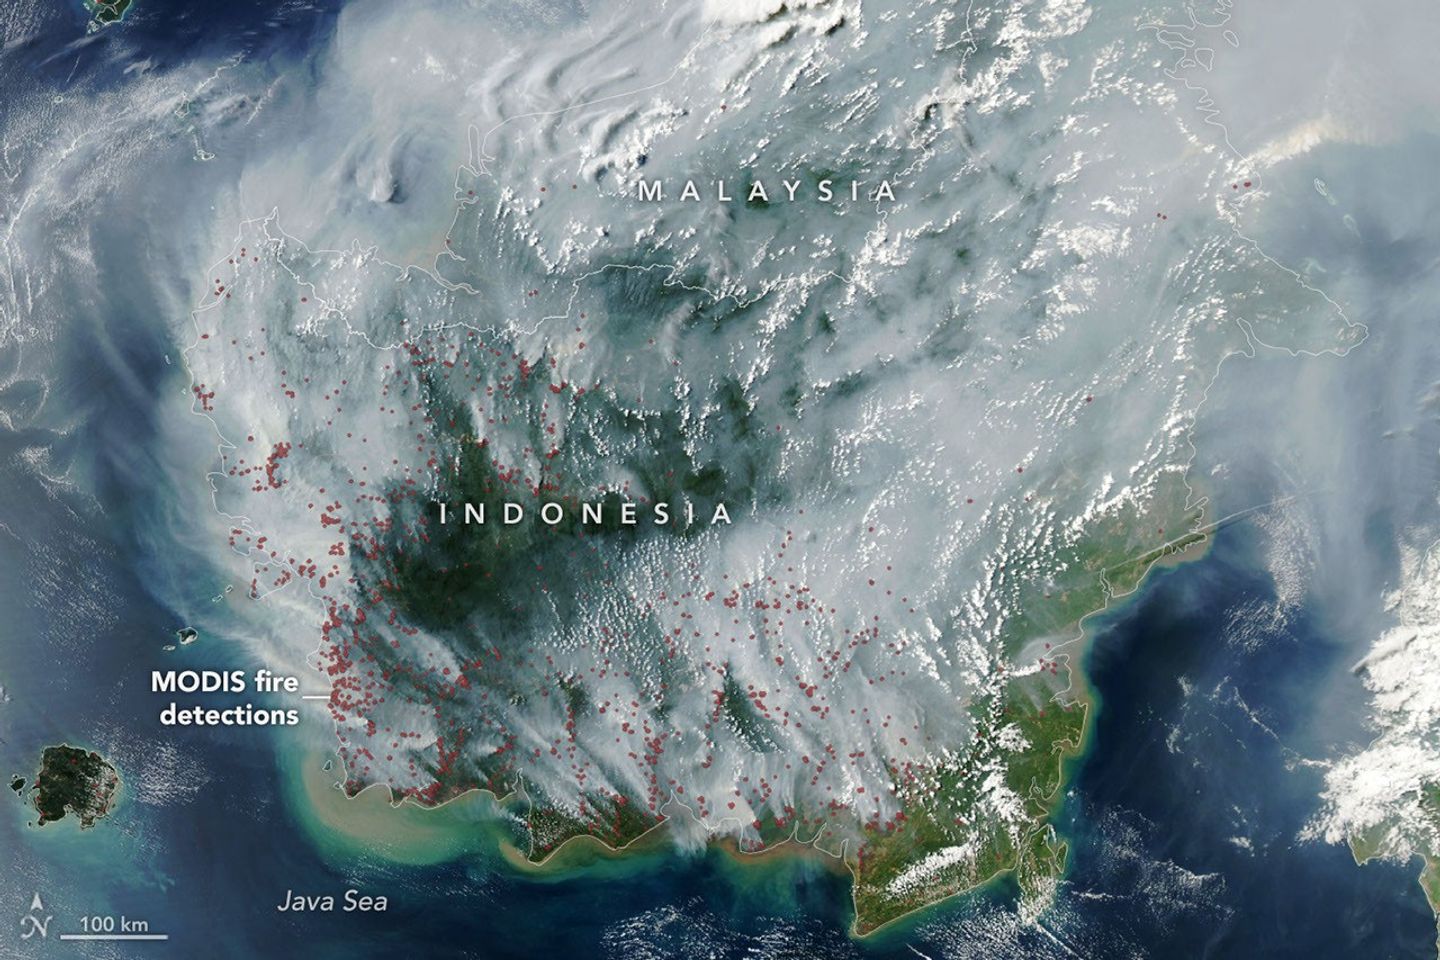
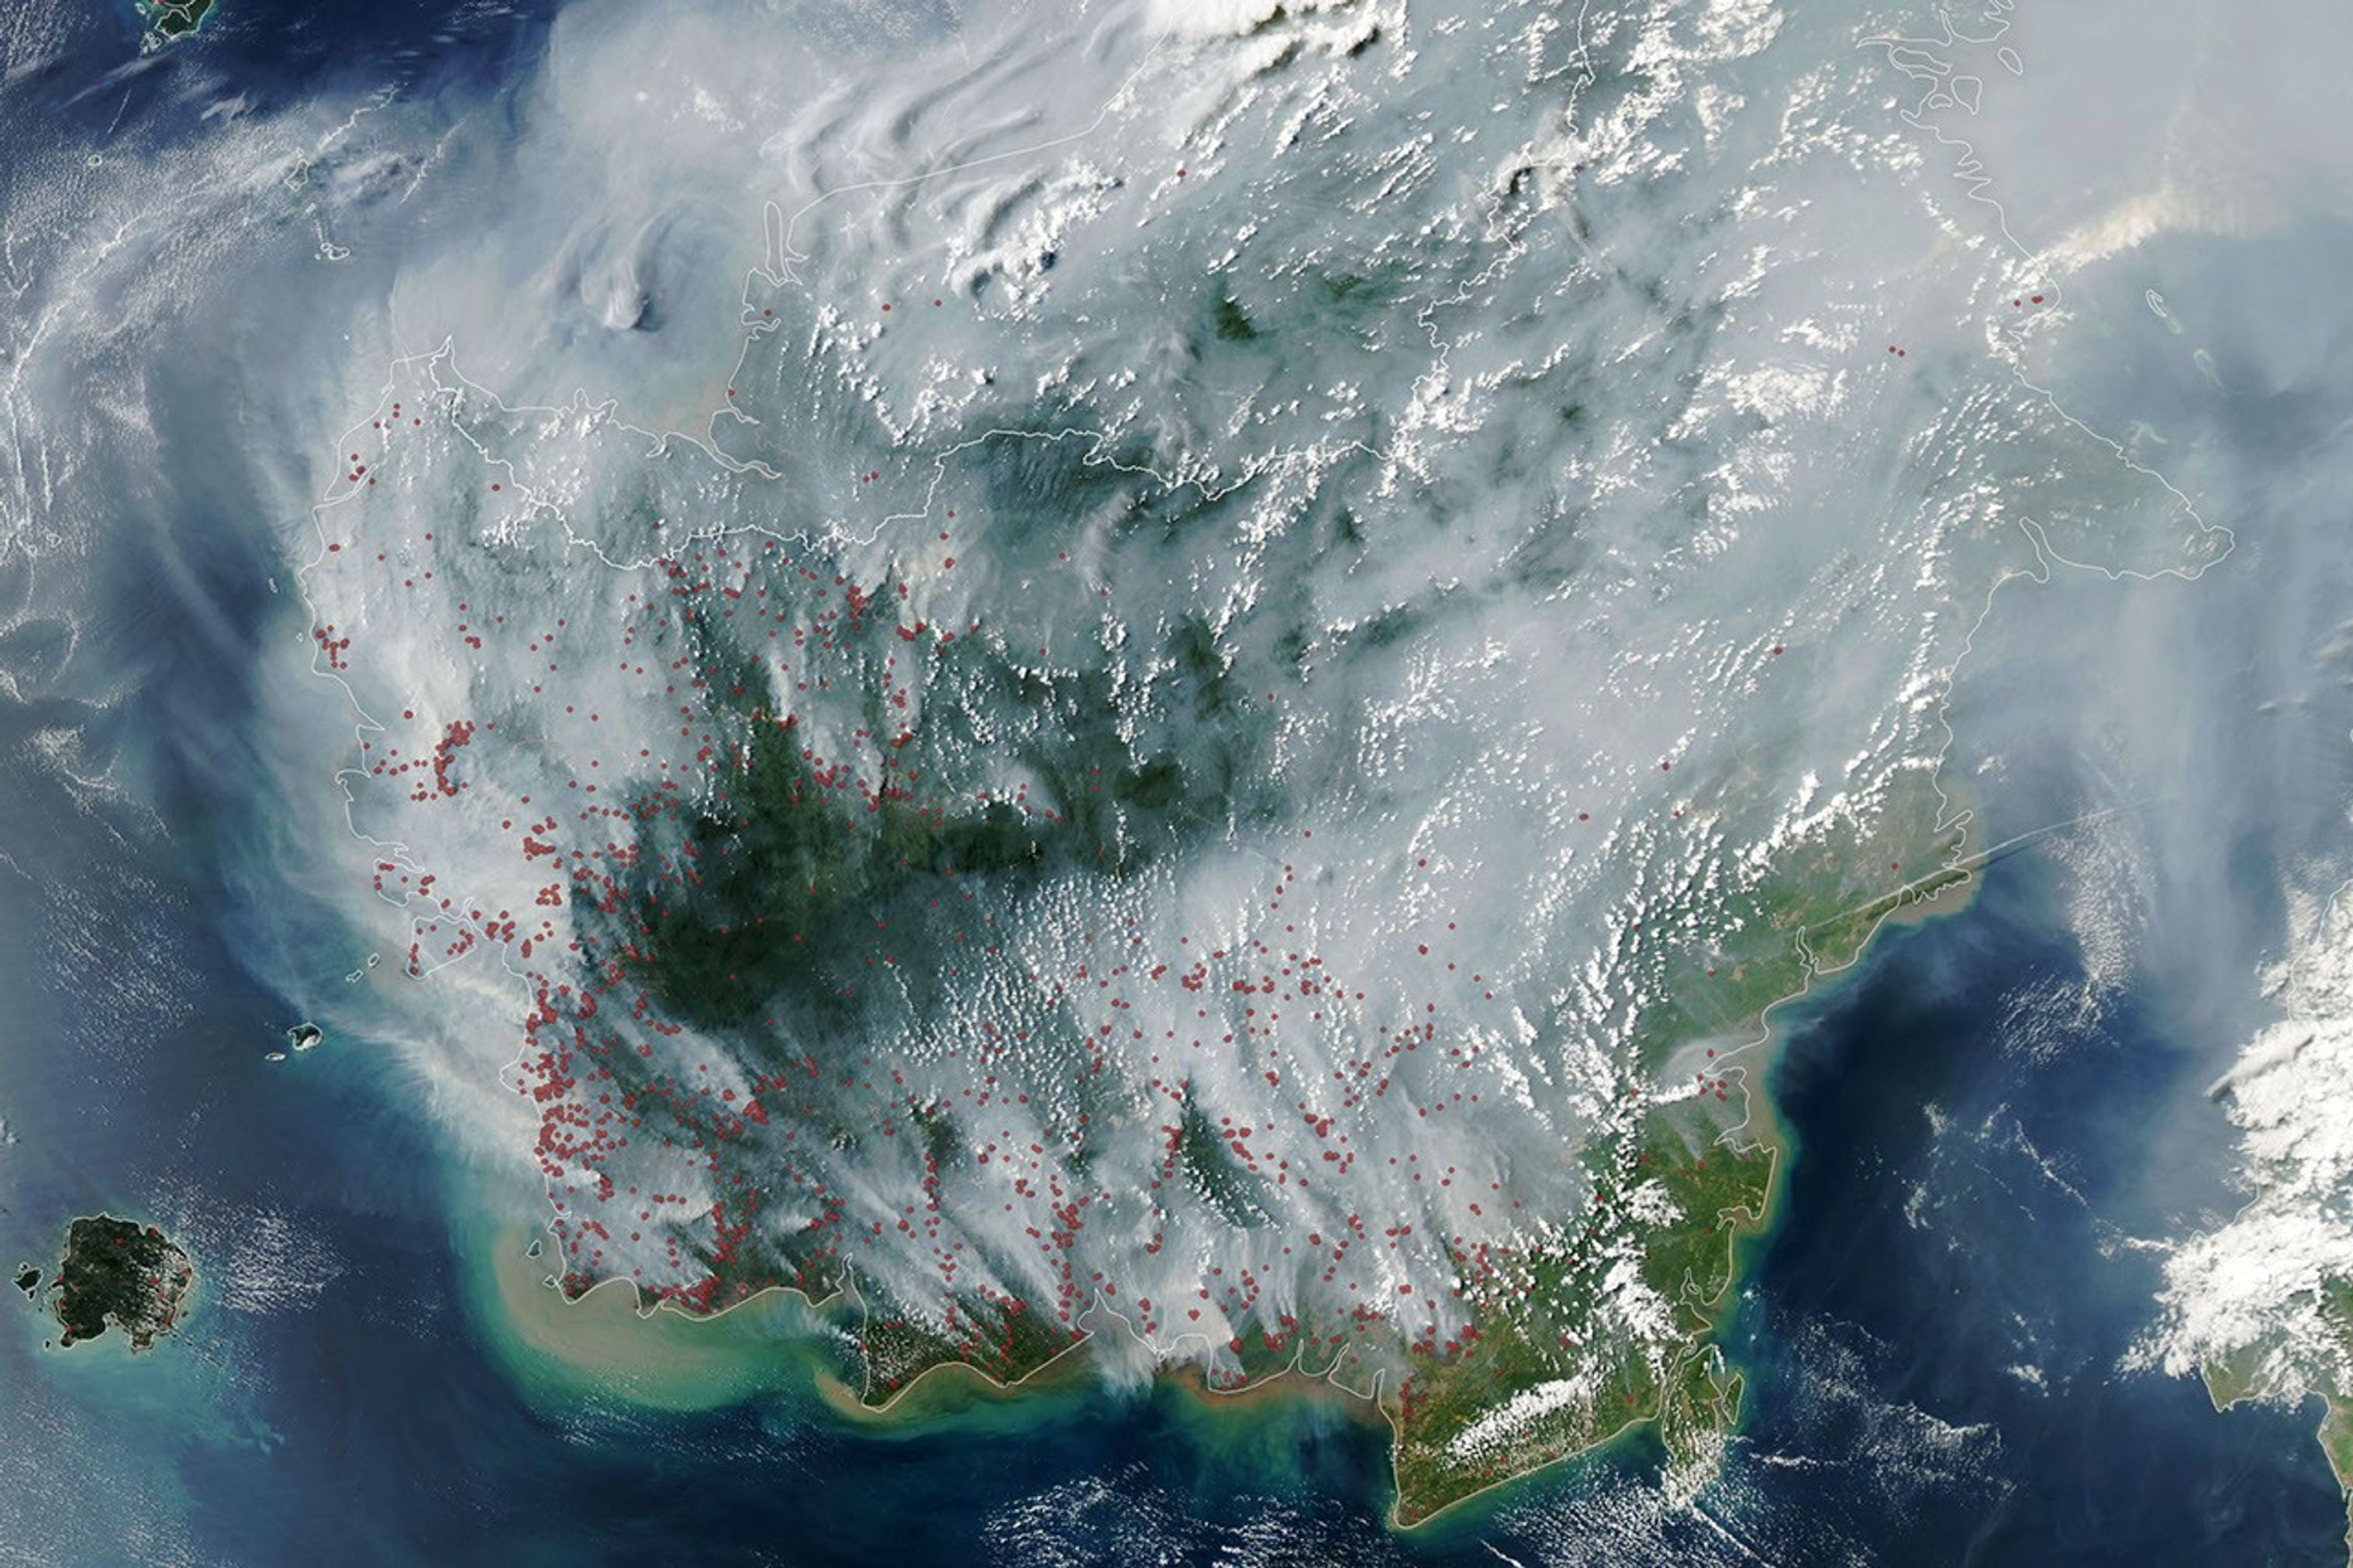
The locations of MODIS fire detections are depicted with small red circles. Most are visible on the southern side of the island.
Thick gray plumes of smoke stream from large numbers of fires scattered across the island of Borneo.
NASA Earth Observatory / Lauren Dauphin
The locations of MODIS fire detections are depicted with small red circles. Most are visible on the southern side of the island.
No Fire Detections
Fire Detections
If there were an apex predator among fires, tropical peatlandfires would be a top contender. These fires, which burn in dried wetland soils, are slow-burning, highly polluting, and notoriously difficult to extinguish because they smolder at low temperatures and often burn underground through expansive deposits of peat. By one estimate, peat fires generate three times more fine particulate matter than other tropical forest fires, five times more sulfur dioxide, three times more organic carbon, and two times more methane and carbon monoxide.
Fire season was underway in Indonesia when the MODIS (Moderate Resolution Imaging Spectroradiometer) on NASA’s Aqua satellite captured this image on September 1, 2026. In the map on the right, each red dot depicts one “fire detection.” A fire detection is a pixel in which the sensor and an algorithm determined there were thermal anomalies indicative of fire. Multiple detections can be generated by a single fire.
Peat fires are a recurring challenge in Indonesia, which is home to about 36 percent of the world’s tropical peatlands. When parched by drought, the archipelago’s peat landscapes have become unrelenting infernos on several occasions over the past three decades, with fires producing blankets of smoke for weeks on end and upending daily life for millions of people.
While fires occur in Indonesia every year, previous El Niño years—1997 and 2015 especially—produced the most extreme burning in recent decades. The climate pattern, assessed by NOAA as present and strengthening in August, typically leads to sharp reductions in rainfall in Indonesia, particularly when combined with a positive phase of the Indian Ocean Dipole, which was also present.
“Indonesia is only about three weeks into its fire season, but we’re seeing fire activity track sharply upward, similar to 2015,” said Robert Field, a Columbia University researcher who developed a tool called the Global Fire Weather Database that produces experimental, real-time fire weather forecasts. “The strong El Niño is making the dry season drier over the fire-prone parts of the country and exacerbating burning—just as we anticipated it would,” he said. In 2015, after burning for more than three months, Indonesia’s fires had released 1.75 billion tons of greenhouse gas equivalents—more than Japan emits in a year. As of September 2, Indonesia’s 2026 fires, having burned for about a month, have released roughly 10 percent as much as the 2015 fires.
As in 2015, Indonesia was in the midst of a severe and widespread drought in summer 2026. About 90 percent of the country received little to no rainfall in early August, according to data from the Indonesian meteorological agency. Normally, it’s too wet for fires to spread through underground peat deposits in Kalimantan, Sumatra, and Papua, but they can in dry conditions. “Surface fires are less of a concern, but when fires get underground, they just won’t stop,” Field said. “They’ll keep burning until the rains come in October or November.”
The Indonesian government uses NASA and NOAA observations from the MODIS and VIIRS sensors to track active fires in near-real-time. Indonesia’s Ministry of Forestry MODIS- and VIIRS-based fire-monitoring platform SiPongi, for instance, tallied 946 hotspots on August 31, 2026.
However, it’s difficult for MODIS and VIIRS to detect fires through thick smoke or clouds, within the forest understory, or underground in peat deposits. When Indonesian fires become the most intense, the number of fires recorded by VIIRS or MODIS can actually decrease. “The worst smoke events, paradoxically, can be the hardest to observe from space with MODIS and VIIRS,” said Mark Cochrane, an ecologist at the University of Maryland Center for Environmental Science who has conducted field research on peat fires in Indonesia for nearly a decade.
The large-scale construction of irrigation canals and drainage of peat swamps in the 1990s, part of an effort to establish massive rice farms, contributed to the flammability of the region today by significantly lowering the water table in wetland areas, Cochrane said. He also noted that oil palm and other plantation forestry is common in this region. Yet after an unusually grim fire season in 2015, governments and other organizations have worked to dam up some irrigation canals and restore wetlands. There have also been renewed efforts to improve firefighting capacity and reduce the number of fires that people accidentally ignite.
“This year will be a real stress test of the measures that were put in place after 2015,” said Shi Jun Wee, a University of Maryland graduate student. Wee is working on a team partnering with NASA and MapBiomas to develop new algorithms and techniques to detect more understory fires than MODIS and VIIRS can by tapping into shortwave infrared observations from Landsat and Sentinel-2 satellites. As the fires progress, he plans to track developments using NASA’s Worldview data browser, FIRMS (Fire Information for Resource Management System), HLS (Harmonized Landsat and Sentinel-2) observations, and GFED (Global Fire Emissions Database).
On the ground in Indonesia and neighboring countries, the smoke is already causing widespread disruptions. Indonesian officials have warned that large swaths of the population have been exposed to hazardous smoke. Some schools started shifting to remote learning, nine national parks have closed, and several flights have been delayed due to heavy smoke, according to news reports.
“People tend to focus on these fires during an El Niño and then forget about them,” Cochrane said. “We need sustained focus, even during the years when they aren’t as bad, to solve this,” he said. “These fires create a tremendous amount of emissions.”
NASA Earth Observatory image by Lauren Dauphin, using MODIS data from NASA EOSDIS LANCE and GIBS/Worldview.Story by Adam Voiland.
When hurricane forecasters released their seasonal outlooks in spring 2026, the El Niño brewing in the Pacific contributed to predictions of below-normal activity in the Atlantic basin but above-normal activity in the northeastern and central Pacific basins. In early September, near the climatological peak of hurricane season, those spring outlooks were on target, with the eastern Pacific buzzing with activity and the Atlantic notably quiet.
As of September 3, the Northeast Pacific had produced 15 named storms and six hurricanes, well above the norm for that point in the season. The Atlantic basin, meanwhile, laboring under unfavorable wind shear conditions, had produced just five named storms and no hurricanes. El Niño typically enhances hurricane activity in the eastern and central Pacific basins because of the unusually warm water temperatures it brings to those parts of the ocean. It tends to suppress hurricane activity in the Atlantic basin by shifting large-scale circulation patterns in a way that makes it harder to sustain storms there.
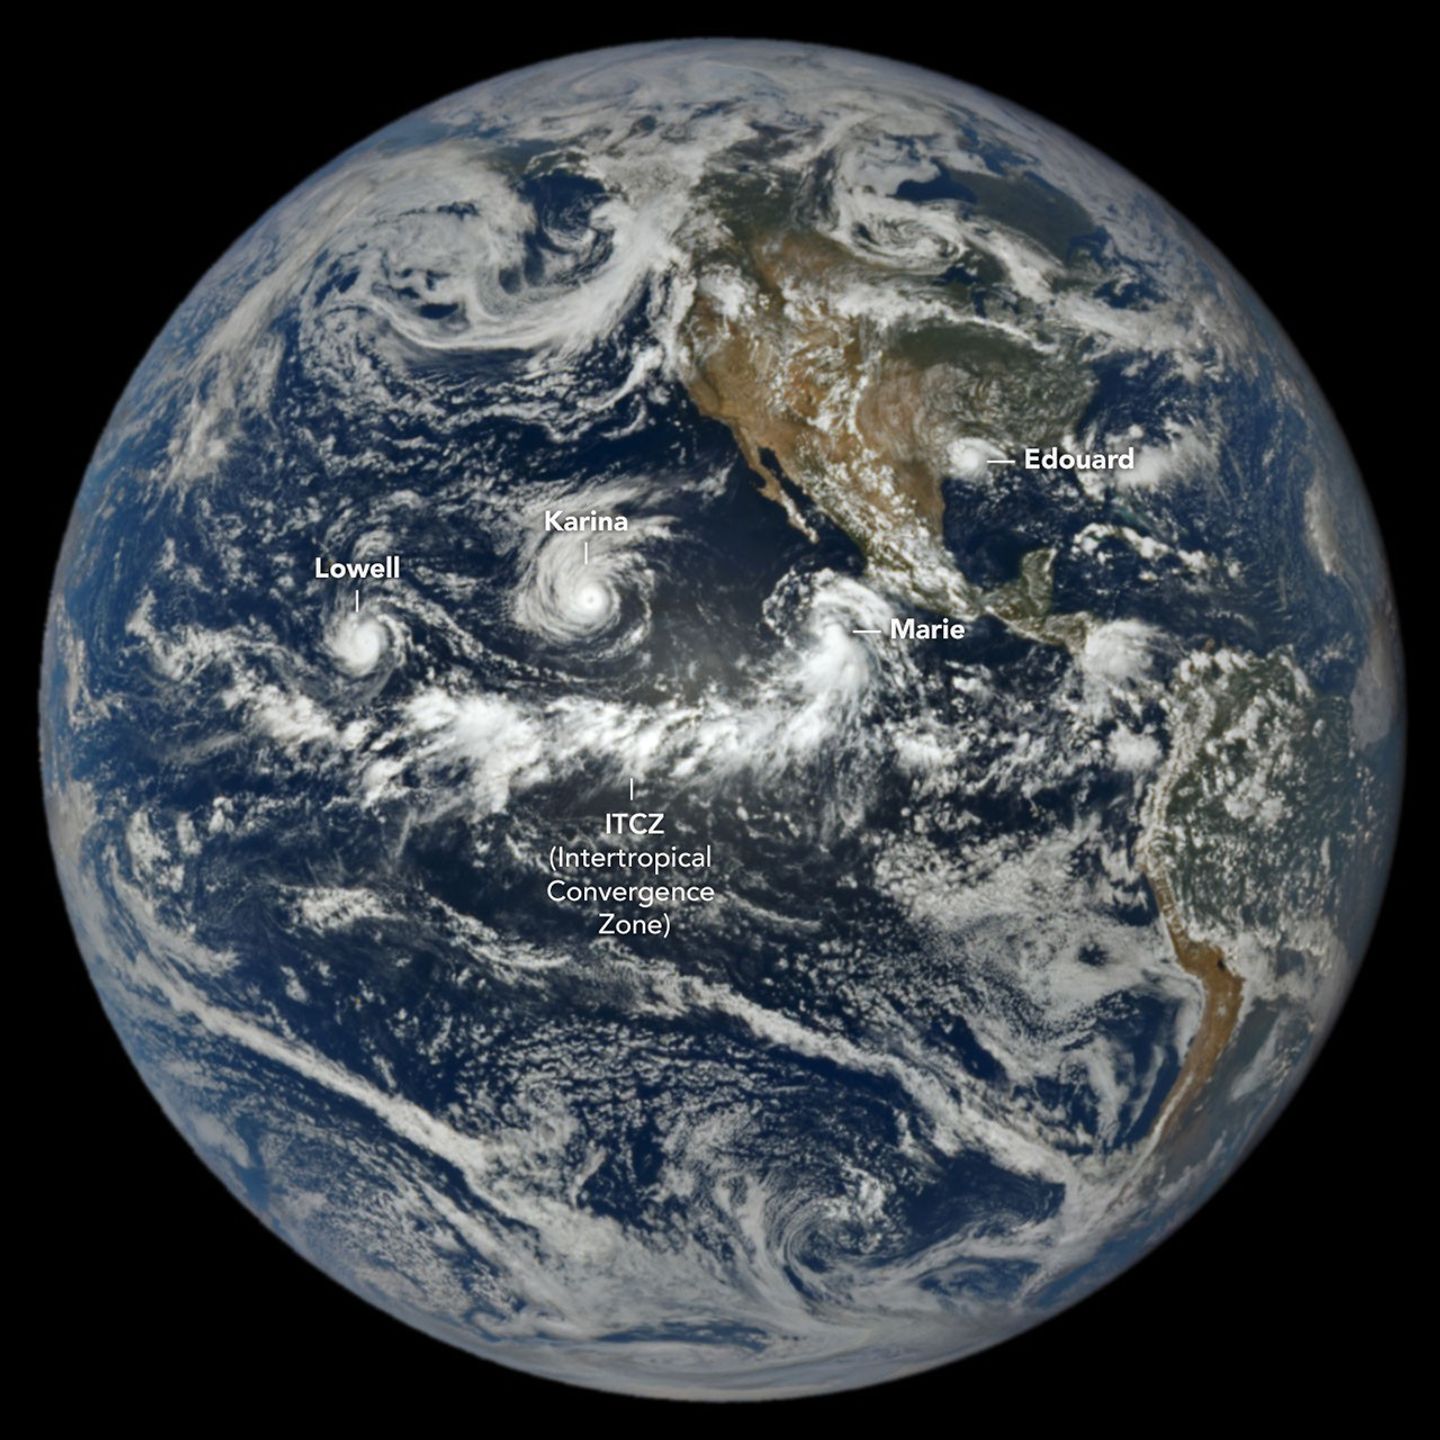
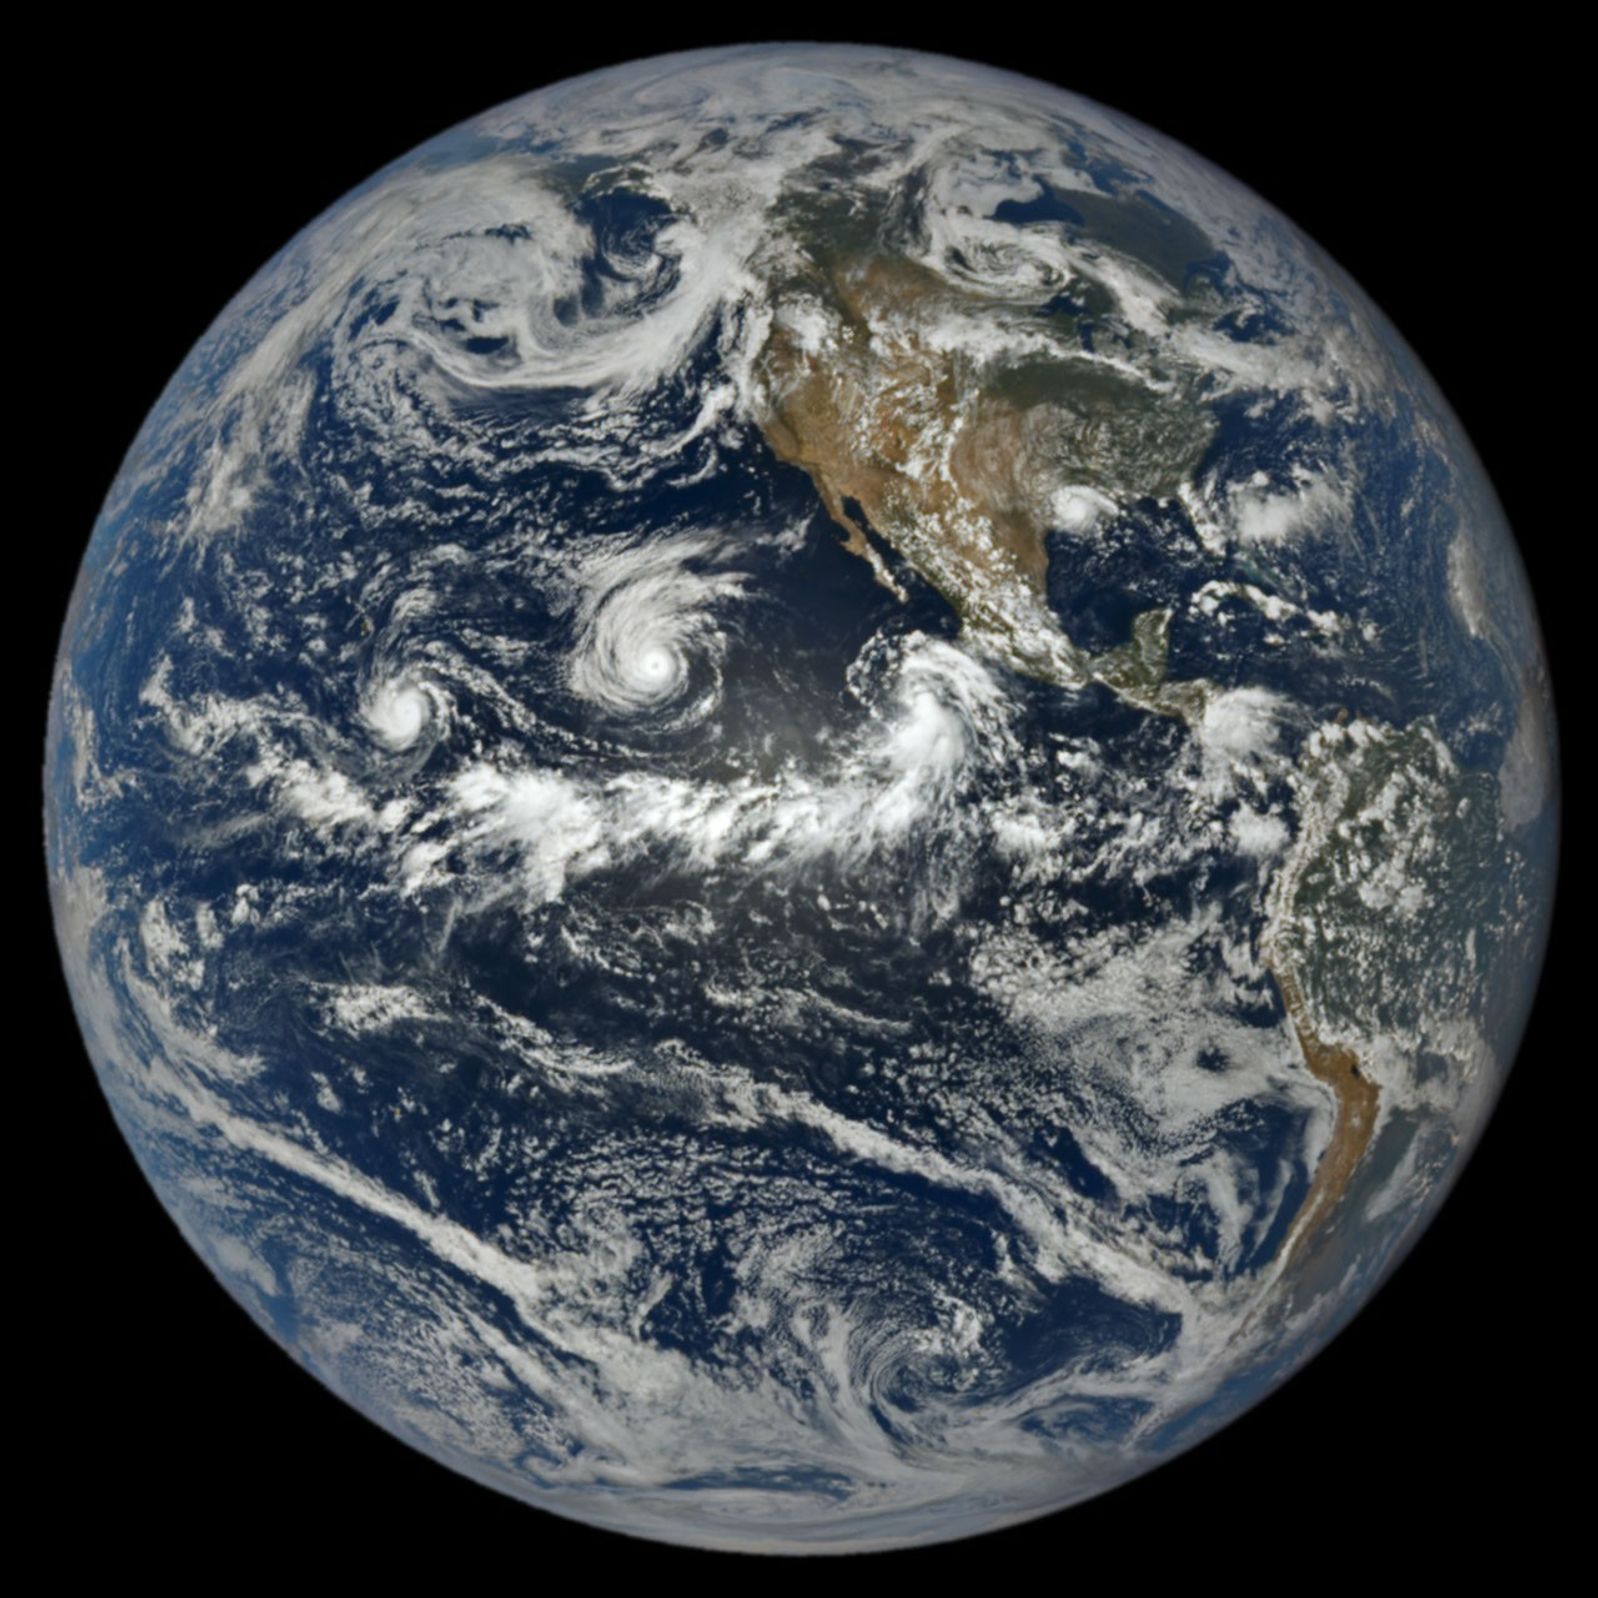
At 1:14 p.m. Pacific Daylight Time (20:14 Universal Time) on September 1, NASA’s EPIC (Earth Polychromatic Imaging Camera) on the DSCOVR (Deep Space Climate Observatory) satellite captured an image of three tropical cyclones churning simultaneously in the Pacific, along with one in the Atlantic. A band of clouds and thunderstorms associated with the Intertropical Convergence Zone (ITCZ) is visible to the south of the storms. The spacecraft was nearly 1 million miles from Earth and just shy of 93 million miles from the Sun when the image was acquired.
The trio of storms in the Pacific were Lowell, Karina, and Marie. Of the three, Lowell became the strongest, with winds reaching category 5 strength for several hours on September 2. Around the same time, Karina, spinning a few thousand kilometers to the east, achieved category 4 strength, a rare case of category 4 and 5 hurricanes occurring simultaneously in the area. Marie, spinning southwest of Baja California, was still a tropical storm when the image was acquired but was strengthening as it moved northwest.
In the Atlantic, Tropical Storm Edouard was visible to EPIC over Louisiana and Texas, shortly after the short-lived storm made landfall. It brought torrential rains and strong winds that downed trees and power lines. Some areas received 15 to 24 inches (38 to 61 centimeters) of rain, according to National Weather Service meteorologists.
As of September 3, the Atlantic basin’s total accumulated cyclone energy (ACE) index was 4.4, about 9 percent of normal for that date, according to statistics compiled by Colorado State University meteorologists. Meanwhile, the Northeast Pacific basin’s ACE was 130, about 50 percent above normal. The ACE index incorporates both the intensity and longevity of storms, making it easier to compare individual storms and seasons.
Several NASA Earth-observing platforms provide data that can aid in emergency preparedness before landfall and damage assessment and response afterward. Use the “Events” tab on NASA’s Worldview browser to track current hurricanes and explore related NASA data products.
NASA Earth Observatory image by Lauren Dauphin, using data from DSCOVR EPIC. Story by Adam Voiland.