NASA’s Machines for Mars Make Beer Bubbly 

3 min read

Preparations for Next Moonwalk Simulations Underway (and Underwater)

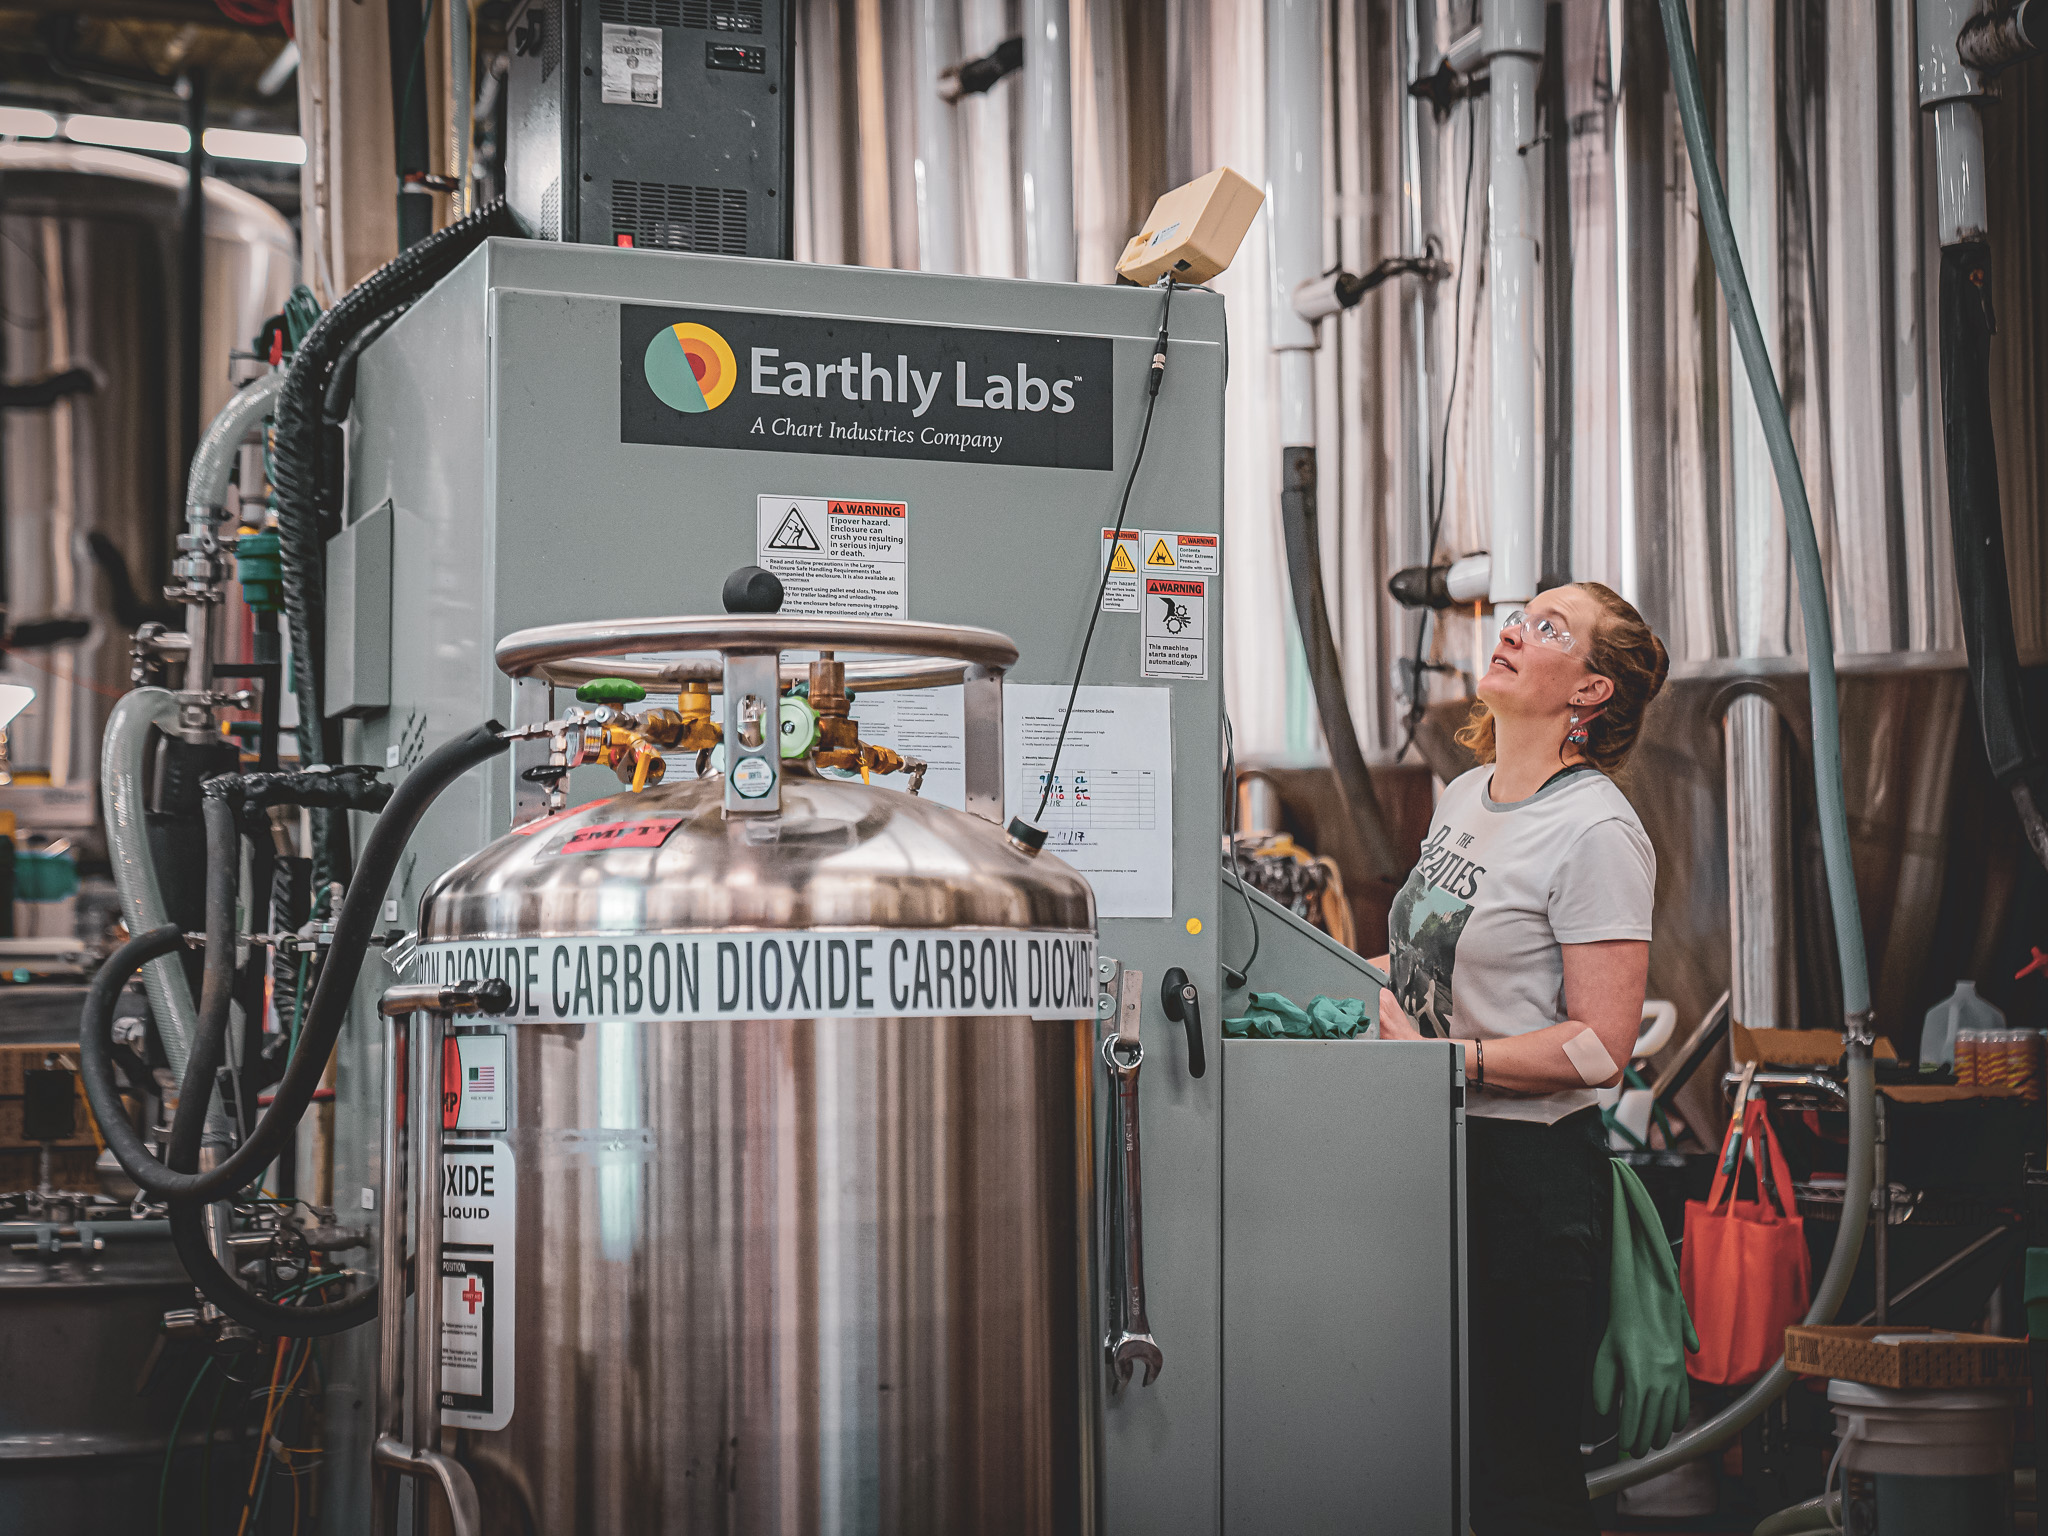
A woman controls an Earthly Labs-branded machine in a factory setting; a tank that says “carbon dioxide” is in the foreground.
A brewer makes adjustments to the Earthly Labs carbon-capture unit, which purifies carbon dioxide from the beer brewing process for use in carbonation.
Credit: Chart Industries Inc.

In 2021, Maine Beer Company’s carbon dioxide supplier ran short on carbon dioxide.

“There was potential for our beer to go stale in the tanks,” said Dave Love, the brewery’s sustainability manager. “We wouldn’t be able to use CO2 for any of our bottling, kegging, or centrifuge operations.”

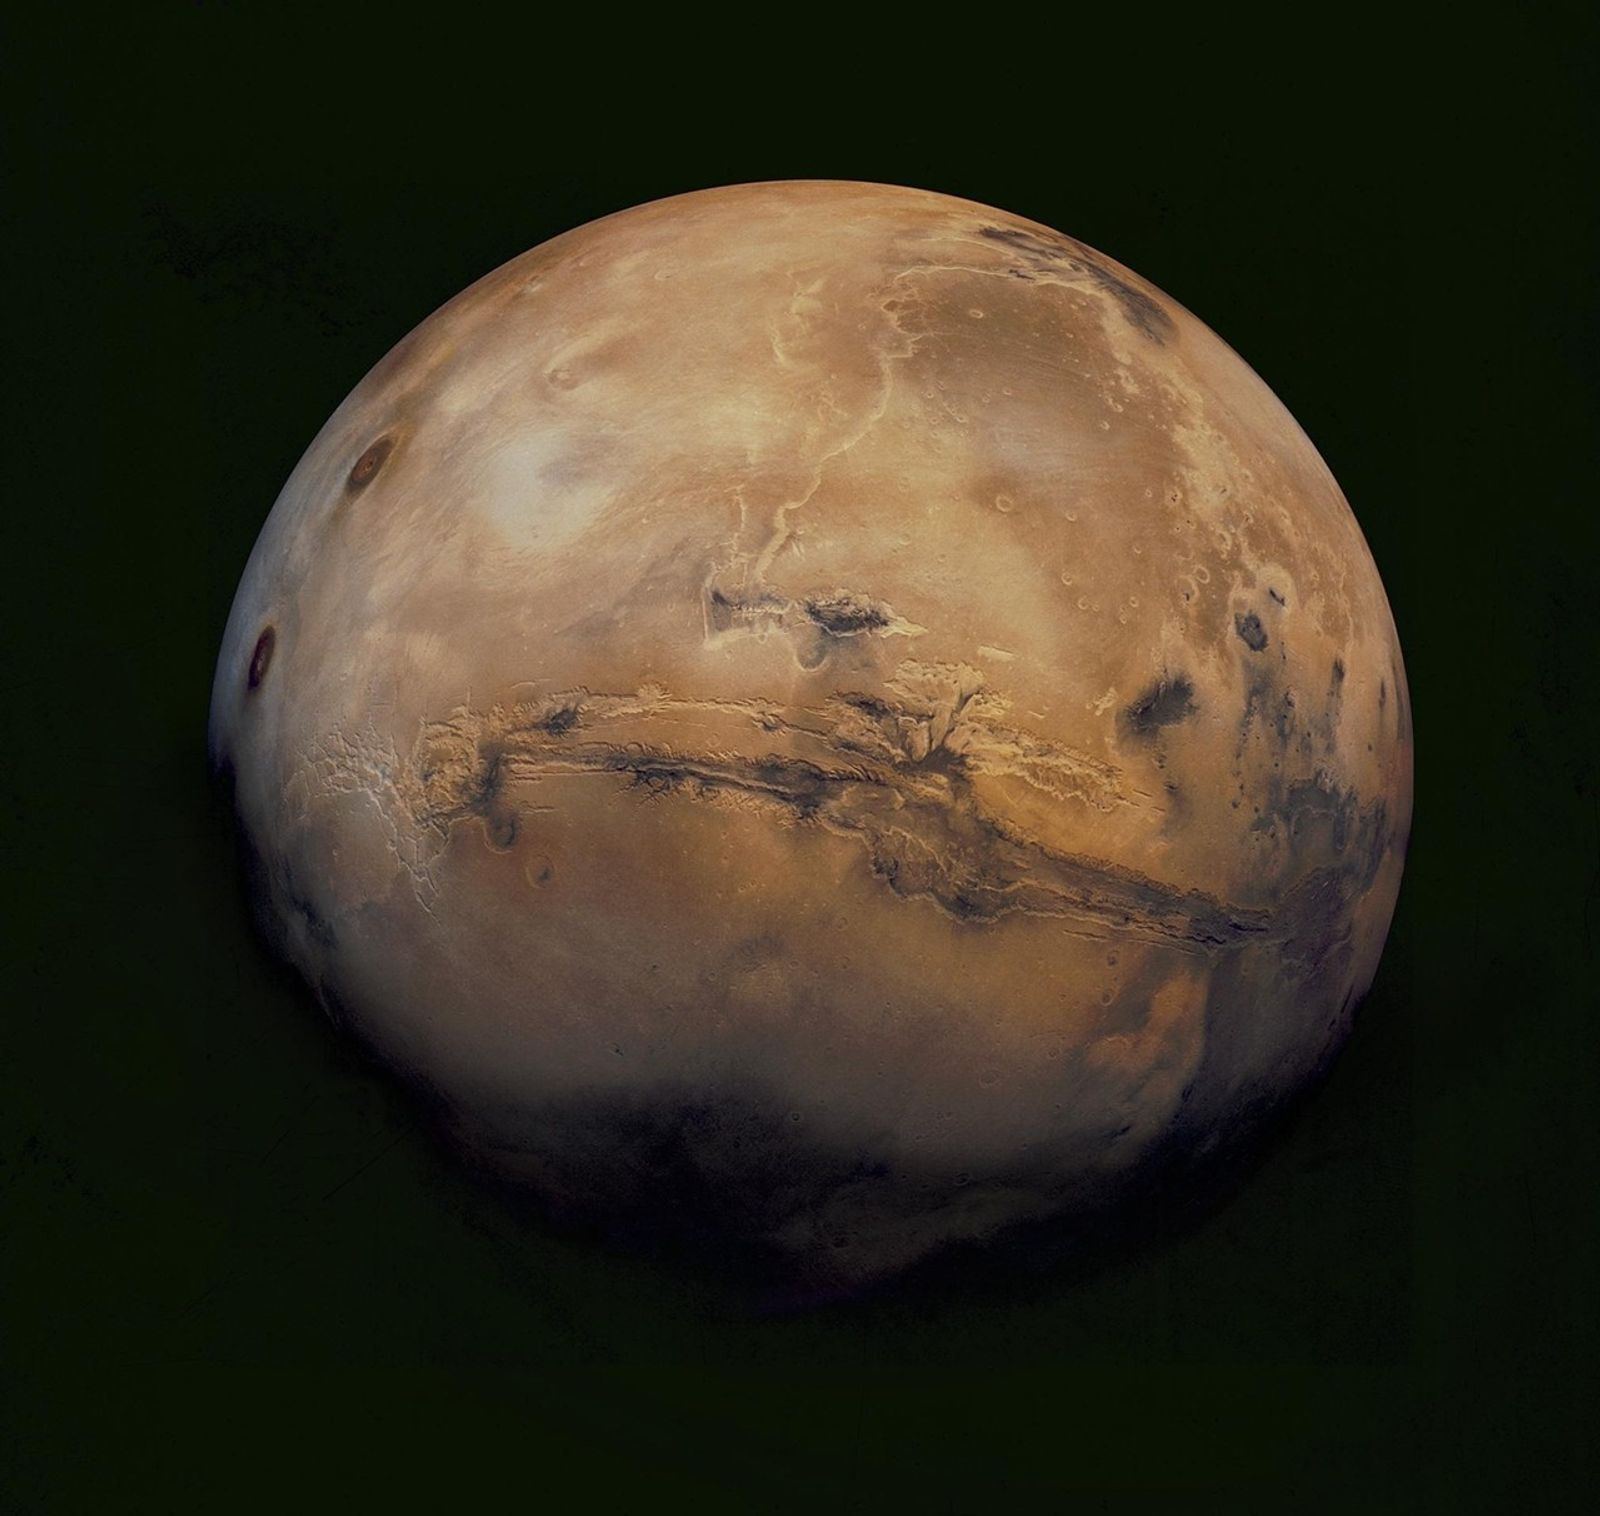
The solution the company settled on originated on Mars — or more specifically, in NASA’s plans for harvesting resources from the Red Planet. Now it’s saving money and reducing emissions for wineries, distilleries, power companies, helium producers, and more.

Beginning in the 1990s, the company Pioneer Astronautics won multiple Small Business Innovation Research (SBIR) contracts from Johnson Space Center in Houston to build systems that could generate resources on Mars. The technology could, for example, capture carbon dioxide from the Martian atmosphere and combine it with hydrogen to produce water for life support and methane for rocket fuel. These capabilities weren’t entirely new, but Pioneer’s systems were compact, efficient, and automated.

Later, Pioneer Astronautics founder Robert Zubrin created Pioneer Energy to rearrange these subsystems into technology for the oil and gas industry (Spinoff 2015, 2020). He soon realized technology for capturing and purifying carbon dioxide on Mars could do the same in a brewery, capturing CO2 from the brewing process for use in carbonation. By 2015, the Craft Brewery Recovery System was in production (Spinoff 2016). In the end, though, the company put the system up for licensing.

Amy George founded Earthly Labs of Austin, Texas, in 2016 to develop small-scale carbon capture. She discovered the Craft Brewery Recovery System and obtained an exclusive license. 

Since the pandemic reduced its availability, carbon dioxide has continued experiencing shortages and volatility, and George said these have emerged as major drivers of interest in the technology. 

And it isn’t just helping brewers. After expanding into wineries and distilleries, Earthly Labs started discovering other markets. Energy companies often generate carbon dioxide as a by-product, which they can sell if it’s captured. Several are now customers.

Another application finding new customers is helium production. Helium, which is used to make microchips and fiber-optic cables, among other applications, is found in underground deposits, mixed with other gases, such as methane and carbon dioxide, that need to be separated. 

In 2021, Earthly Labs was acquired by Chart Industries Inc., which specializes in cryogenic equipment engineering and has helped scale up the technology for applications like power plants.

Details

Last Updated

Sep 24, 2026

Source: www.nasa.gov

NASA Unveils Winning Designs for Mars Space Food Systems Challenge 

5 min read

Preparations for Next Moonwalk Simulations Underway (and Underwater)

Deep Space Food Challenge Mars to Table

NASA announced the winners of the Deep Space Food Challenge: Mars to Table Thursday, with the top $300,000 prize being awarded to Chinyere Ukeje of Philadelphia, Pa. for the Adaptive Nourishment Infrastructure (ANI) food system concept. This competition challenged solvers to explore innovative solutions for integrated space food systems that would provide safe, nutritious meals to astronauts living and working in space.   

Mars to Table launched in January 2026 as a follow on to the Deep Space Food Challenge, which NASA ran from 2021-2014 in collaboration with CSA (Canadian Space Agency). The original challenge focused on prototyped novel food production methods, while the 2026 competition asked teams to conceptualize space meals not as individual technology components, but as a complete food-production system that would offer a variety of food with limited crew time and work needed to maintain the food system. After judging 113 submissions by teams hailing from 33 countries and 28 U.S. states, the agency selected five winning teams for the 2026 challenge, awarding a combined $650,000. 

“We’re thrilled to keep advancing the future of space food systems with this challenge,” said Jennifer Edmunson, program manager for Centennial Challenges at NASA’s Marshall Space Flight Center in Huntsville, Alabama. “The future of human space exploration will rely on innovative food systems, and it is amazing how much ingenuity this challenge has helped us identify from participants near and far.” 

Currently, astronaut meals are almost entirely cooked, packaged, and sent to the International Space Station from the Space Food Systems Laboratory at NASA’s Johnson Space Center. A one-way trip to Mars will take at least nine months, so bringing all required meals will not be sustainable for such missions. From shelf stability issues to mass restrictions, pre-packaged foods cannot be the default option for future Martian astronauts.  

In search of viable solutions for future space food operations, teams were tasked with ideating and designing systems in response to a mission scenario that addressed a 15-person astronaut crew for 500 Martian sols, or about 513 Earth days. The challenge focused on surface operations and system integration, and each team delivered a design layout, meal plan, concept of operations, and walkthrough video. 

“The criteria we laid out for this competition were challenging, but intentionally so,” said Mars to Table head judge Dr. Alexander Meyers, who supports NASA Centennial Challenges through Noetic Strategies from the agency’s Kennedy Space Center in Florida. “This challenge spotlights the complexity of a complete space food system and the human ingenuity required to solve these problems. Every new idea presented in this challenge represents a possible new tool in NASA’s plans for the future of space exploration. 

NASA named five winners of the Mars to Table Challenge. These technologies provide NASA with inspirational launching pads for future deep space food systems. 

The first-place winner, Chinyere Ukeje, developed the concept of ANI, a modular food ecosystem combining controlled-environment agriculture, fermentation and fungi cultivation, and closed-loop nutrient recycling through bioreactors with limited Earth-provisioned foods to produce 50% of the food away from Earth. ANI, named after the Nigerian Earth goddess of harvest and fertility, envisions a system that cooks fresh meals daily and has provisions to work through shortages of power, water, equipment, or crew time. 

The second-place prize of $200,000 was awarded to Cislune of Rosemead, Calif. for the Fresh, Ferment, Reserve food infrastructure. The proposed system grows model-selected crops, converts part of the harvest into familiar foods in instrumented culture cassettes, and uses a protected Earth-loaded reserve to supplement in cases of biological variability, utility curtailment, and rejected batches. 

Additional prizes include: 

  • Applied Frameworks Award ($50,000): Ohā Kanu from Hilo, Hawaii with ʻOhā Kanu: An Ahupuaʻa-Inspired Food System for Mars 
  • Mission Simulation Award ($50,000): Orbital Health Systems, Inc. from Evansville, Ind. with New Lunar Settlers Cookbook (Mars Edition) 
  • Human-Centered Design Award ($50,000): Autonomic Resilience Collective from Bentonville, Ark. with Adaptive Endurance and Growth through Integrated Sustenance (AEGIS) Mars 

NASA also recognized one international team: 

  • International Winner: Astrofood from Ellezelles, Belgium with Food Resilience Ecosystem for Space Habitats (FRESH) 

The Deep Space Food Challenge: Mars to Table is managed at NASA Marshall by Centennial Challenges, part of the Prizes, Challenges, and Crowdsourcing Program within NASA’s Research and Technology Mission Directorate. The challenge is also supported by NASA’s Division of Biological and Physical Sciences, Heliophysics Division, Planetary Science Program, Human Research Program, and Earth Science Division.  

Centennial Challenges have a legacy of more than 20 years engaging the public to solve complex problems that benefit NASA’s broader initiatives. Past challenges have spurred advances in robotics, additive manufacturing, power and energy, textiles, chemistry, and biology.  

The Deep Space Food Challenge: Mars to Table is also supported by subject matter experts at NASA Johnson and NASA Kennedy. The Methuselah Foundation and Floor23 Digital support the administration of this challenge.  

To learn more about the challenge, visit: 

go.nasa.gov/marstotable  

Source: www.nasa.gov

Lake Powell Drops to Record-Low Levels


September 1, 2017
September 10, 2026

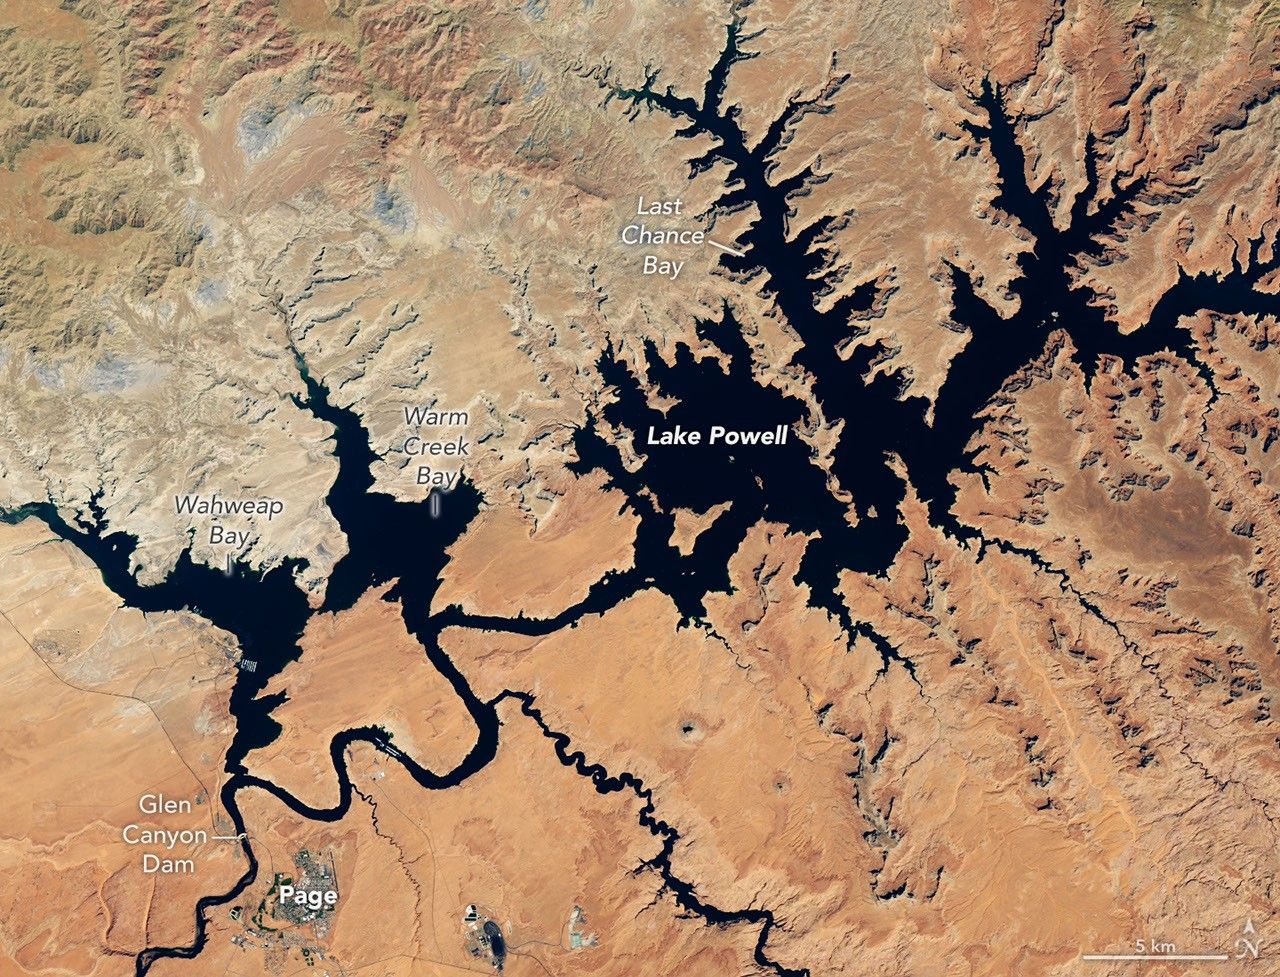
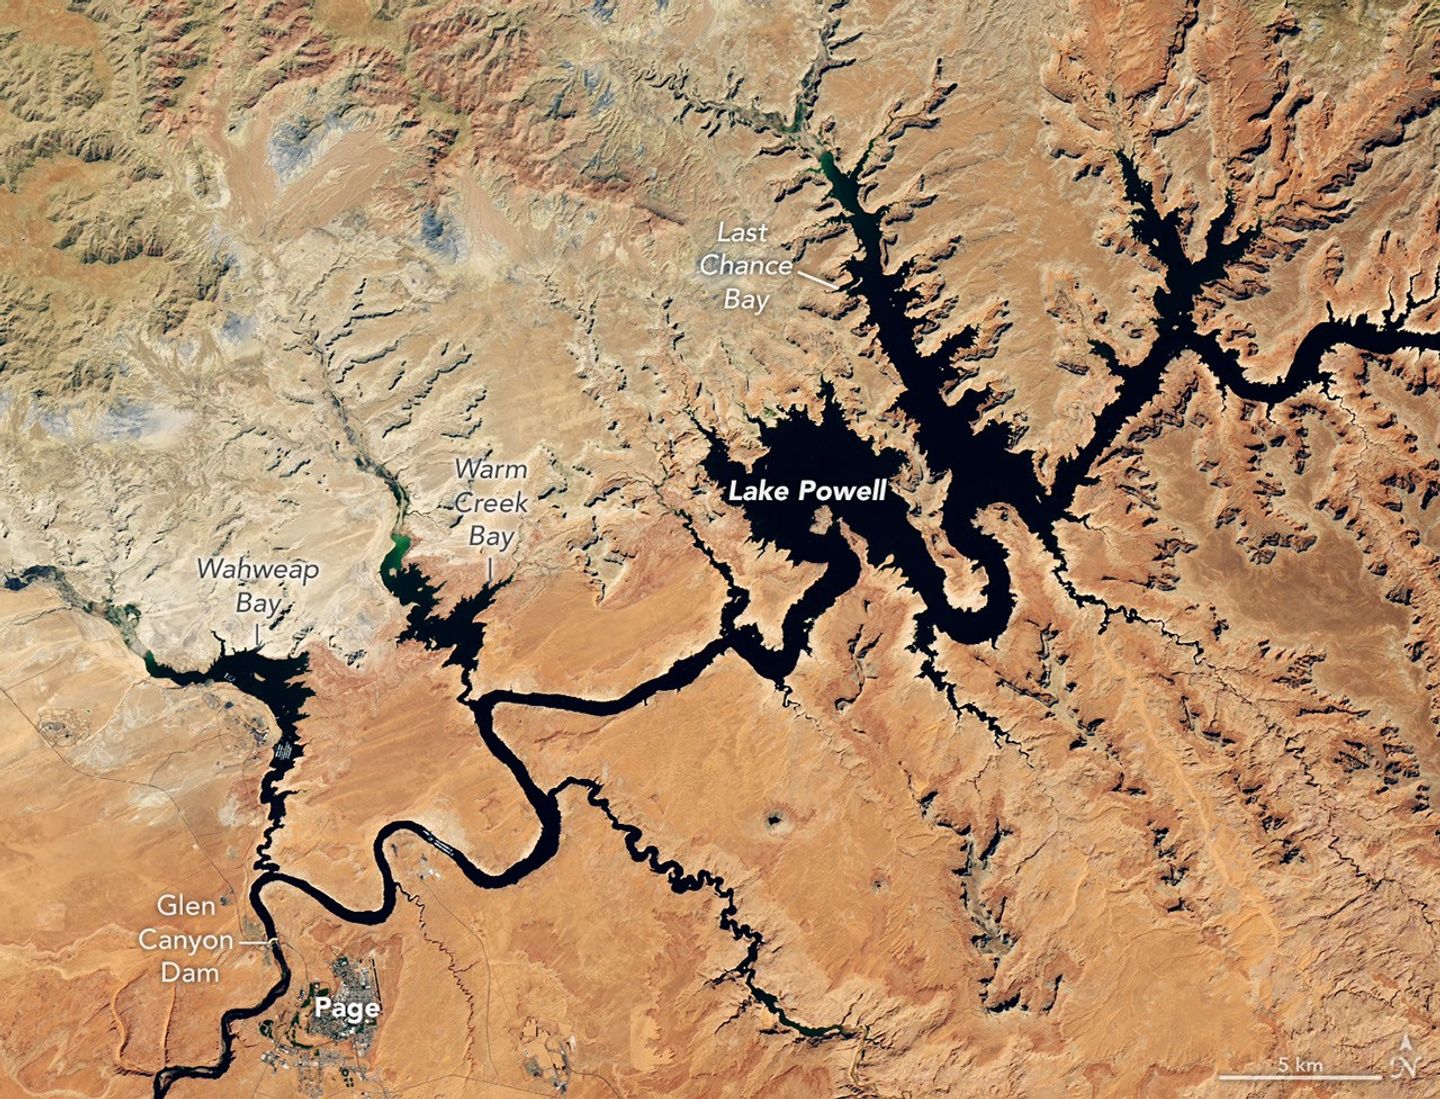
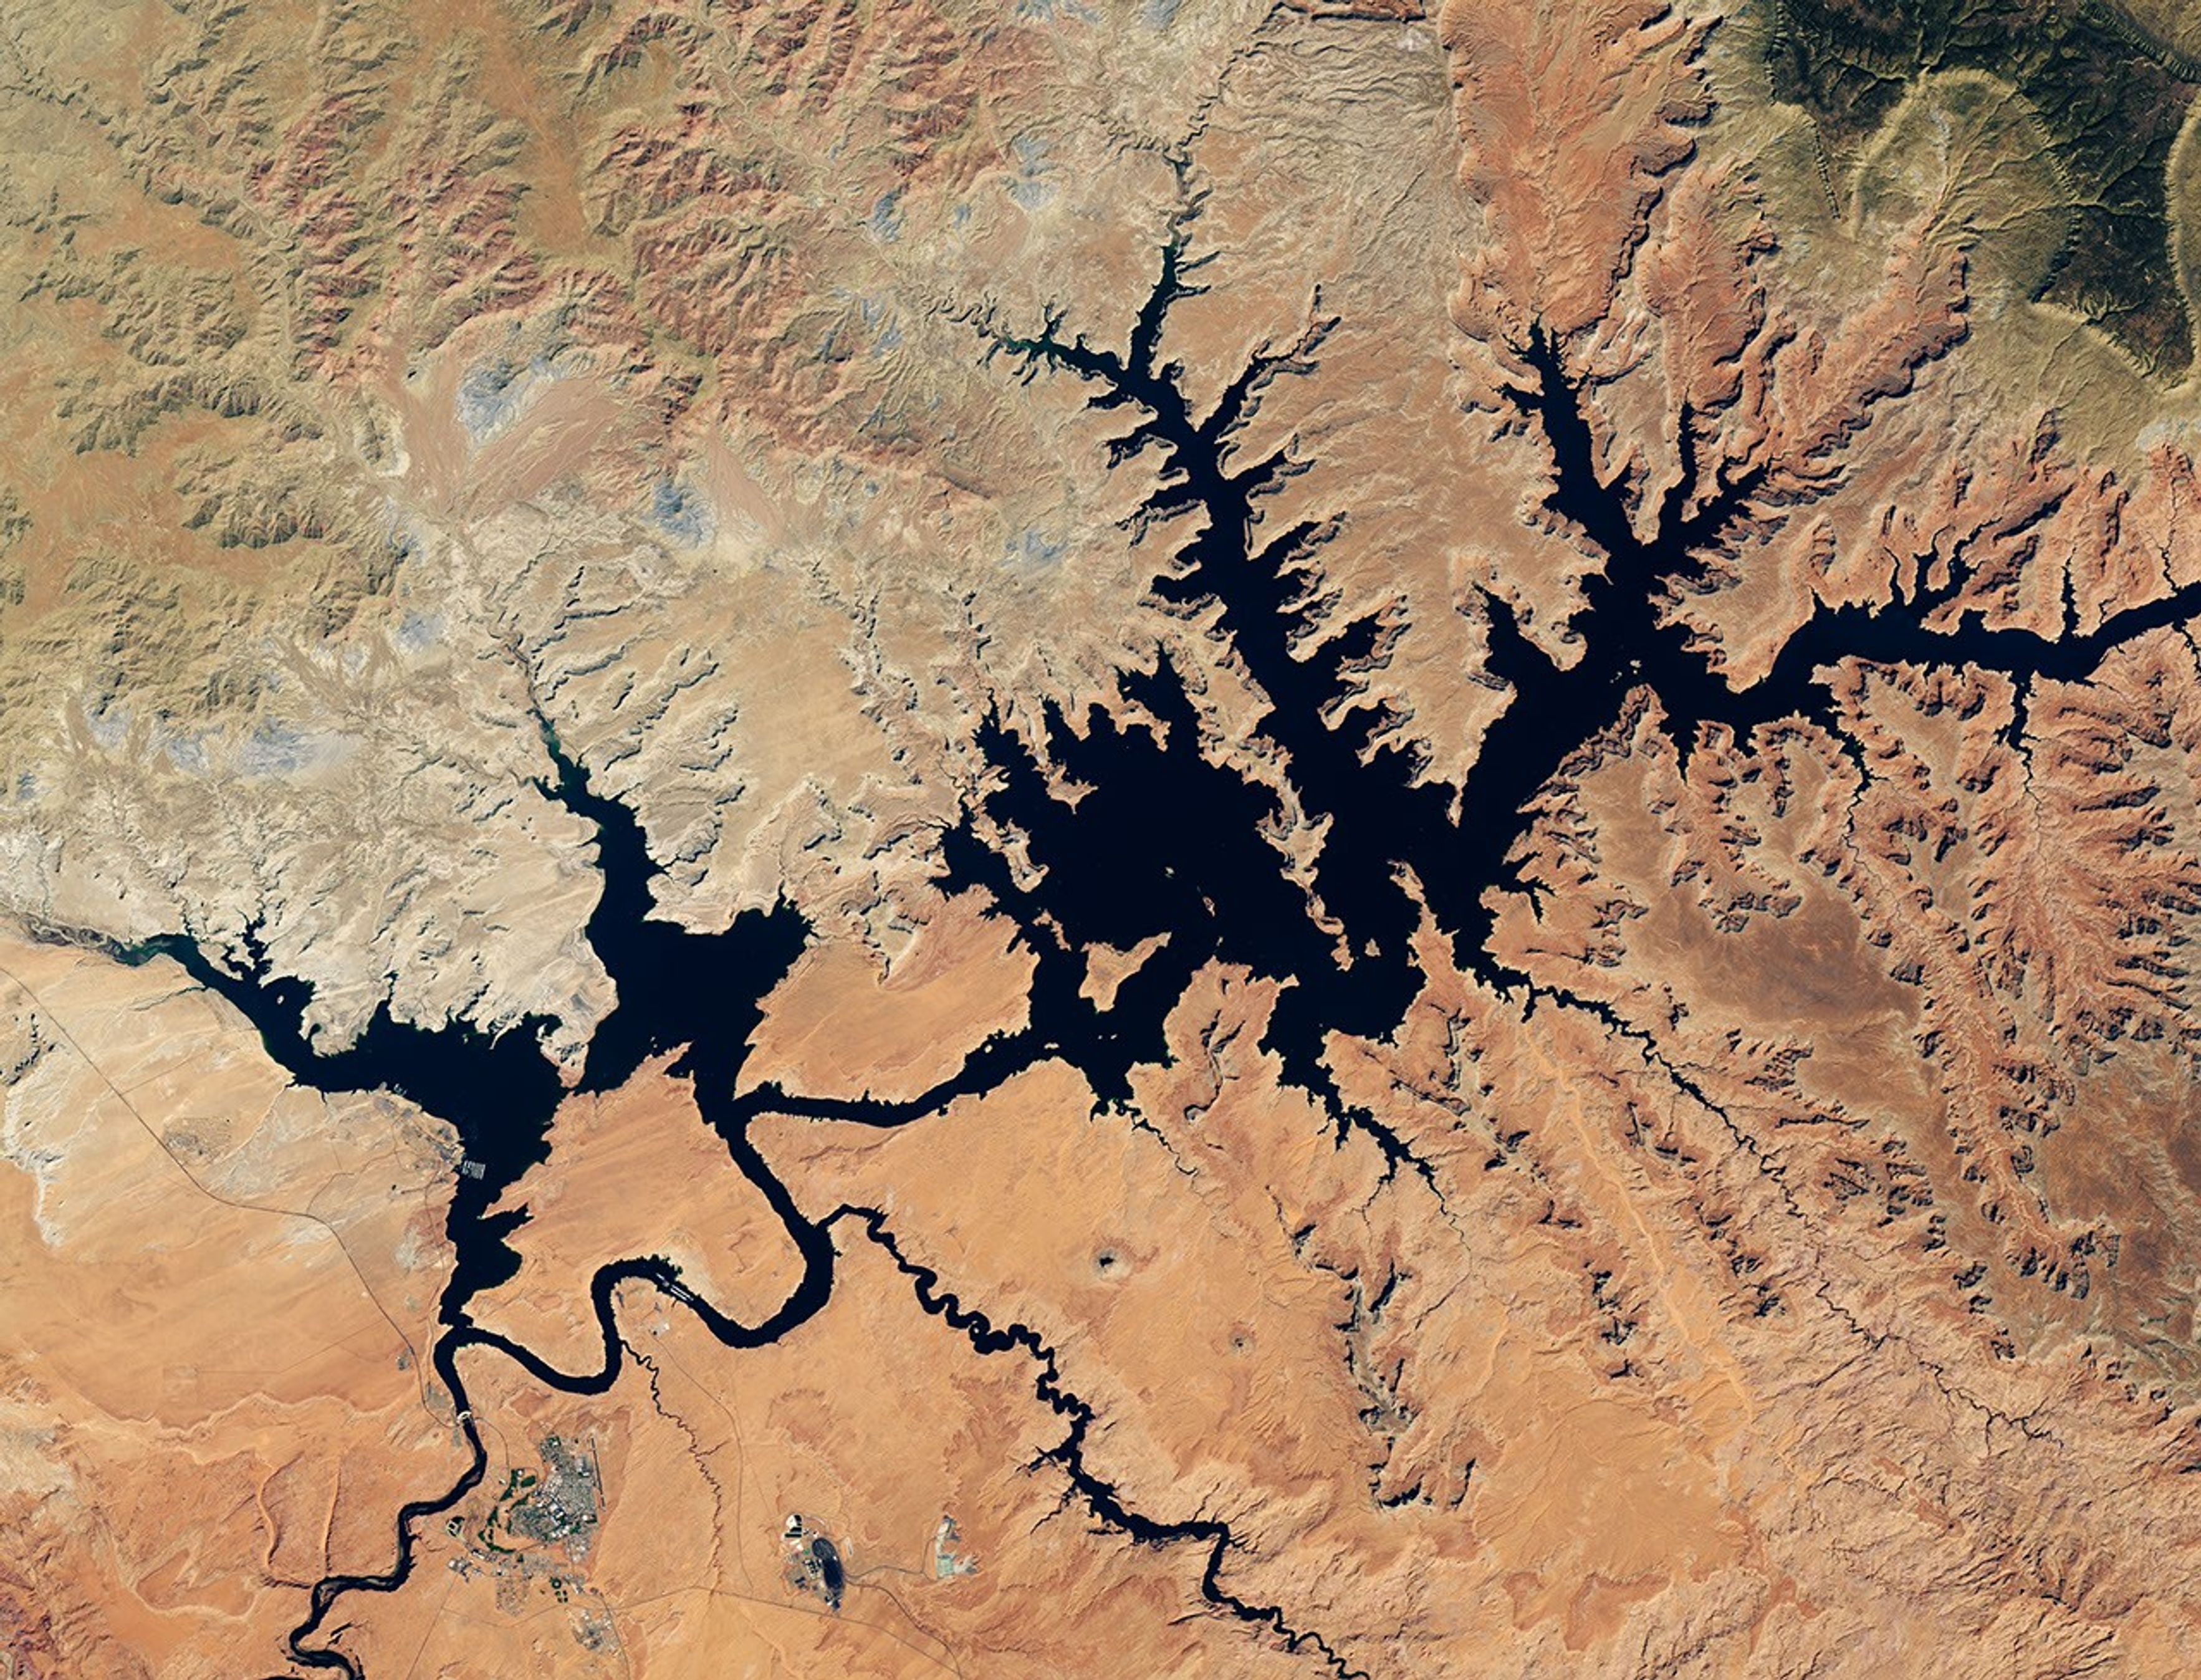
Dark blue water in Lake Powell fills several bays and branching canyons amid a light orange desert landscape. The Glen Canyon Dam and the town of Page, Arizona, are visible in the lower left.
NASA Earth Observatory / Lauren Dauphin

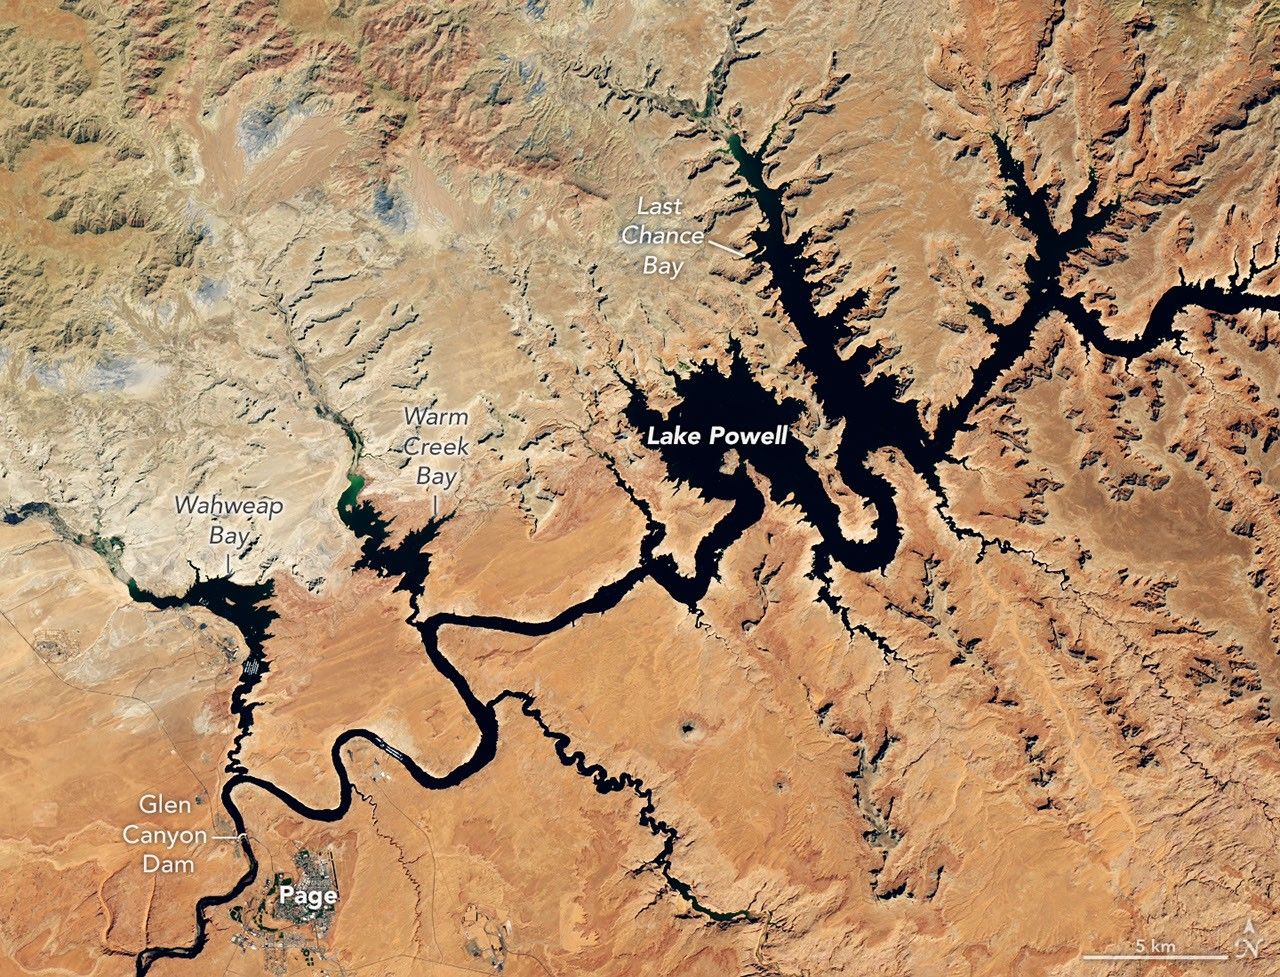
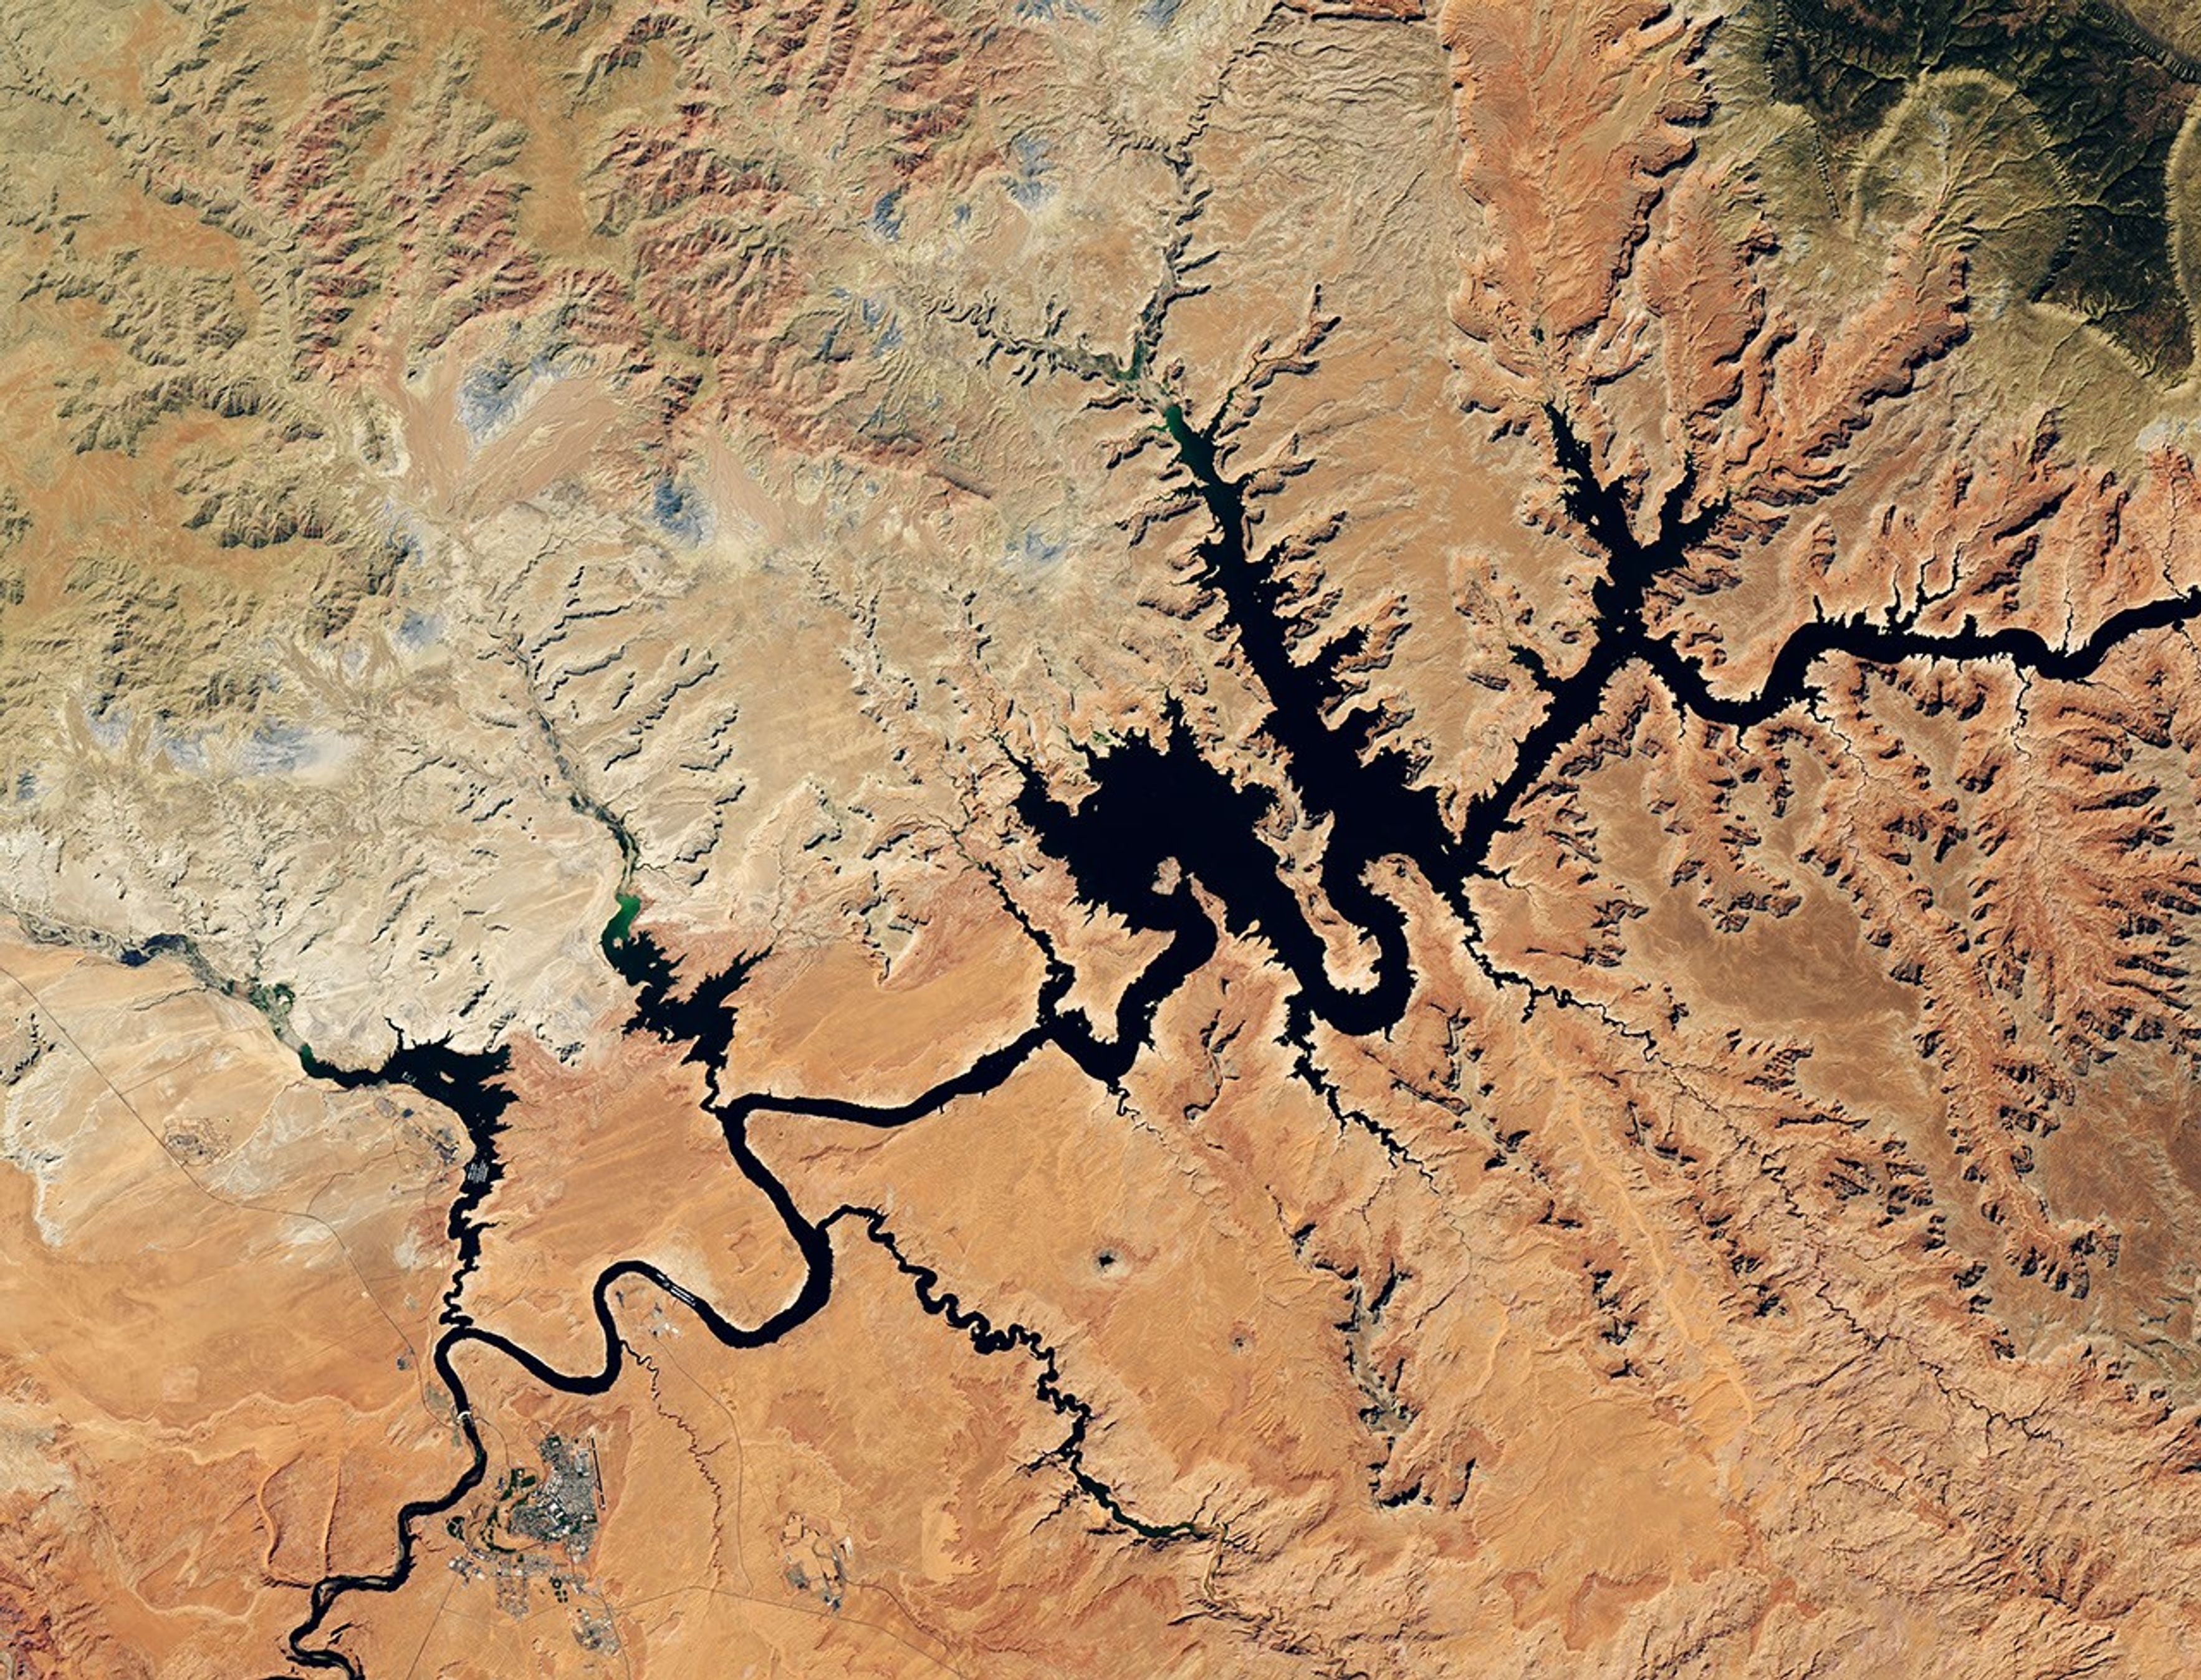
Water in Lake Powell is at record-low levels and looks like a wide river winding through a light orange desert landscape. The Glen Canyon Dam and the town of Page, Arizona, are visible in the lower left.
NASA Earth Observatory / Lauren Dauphin

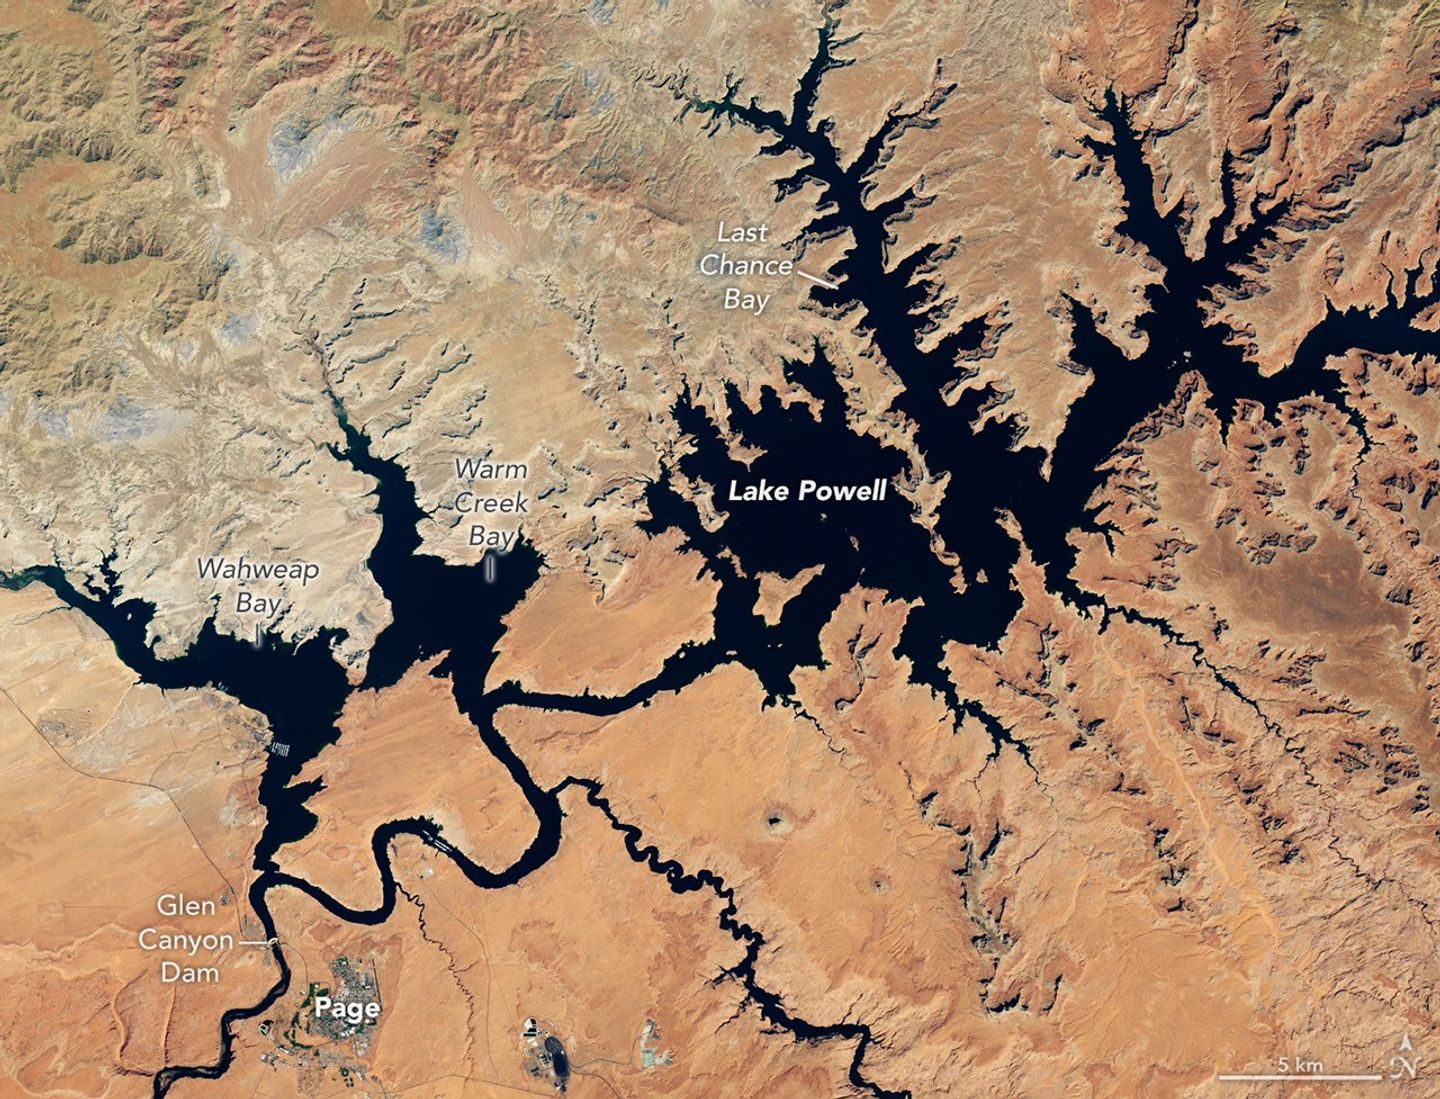
Dark blue water in Lake Powell fills several bays and branching canyons amid a light orange desert landscape. The Glen Canyon Dam and the town of Page, Arizona, are visible in the lower left.
NASA Earth Observatory / Lauren Dauphin

Water in Lake Powell is at record-low levels and looks like a wide river winding through a light orange desert landscape. The Glen Canyon Dam and the town of Page, Arizona, are visible in the lower left.
NASA Earth Observatory / Lauren Dauphin


September 1, 2017

September 10, 2026


Lake Powell stood at one of its highest levels in the past decade on September 1, 2017 (left), and at a record low on September 10, 2026, in these images acquired with the OLI (Operational Land Imager) on Landsat 8. NASA Earth Observatory images by Lauren Dauphin.

The effects of a meager mountain snowpack across the Upper Colorado Basin in winter 2025-2026 had made their way downstream to Lake Powell by summer. After seasonal snowmelt declined to a relative trickle, the second-largest reservoir in the U.S. sat at record-low levels in late August and early September.

These images show a portion of Lake Powell just above Glen Canyon Dam as observed by the OLI (Operational Land Imager) on the NASA-USGS Landsat 8 satellite on September 1, 2017 (left), and September 10, 2026 (right). In the 2026 image, the water level stood at 3,517.24 feet. About a month prior, it had dipped below the previous record-low level of 3,519.92 feet, set on April 13, 2023, and continued to tick downward in early September. The 2017 image represents one of the highest water levels of the past decade.

The Colorado River feeds Lake Powell and then Lake Mead farther downstream, which also hit record-low levels in August 2026. Managed by the U.S. Bureau of Reclamation (USBR) and other agencies, the river provides water and electric power to more than 40 million people—including in Las Vegas, Phoenix, Los Angeles, and San Diego—and water to some 5 million acres of farmland in the Southwest.

Much of the Colorado Basin is arid or semi-arid, so a large portion of the river’s flow originates as snowmelt from higher elevations. The Upper Colorado Basin, like many mountainous areas across the U.S. West, saw unusually little snow accumulation in winter 2025-2026, constituting a snow drought. Stretches of record warmth further sapped the snowpack. As a result, water from snowmelt did little to replenish lake levels in spring, as it typically does.

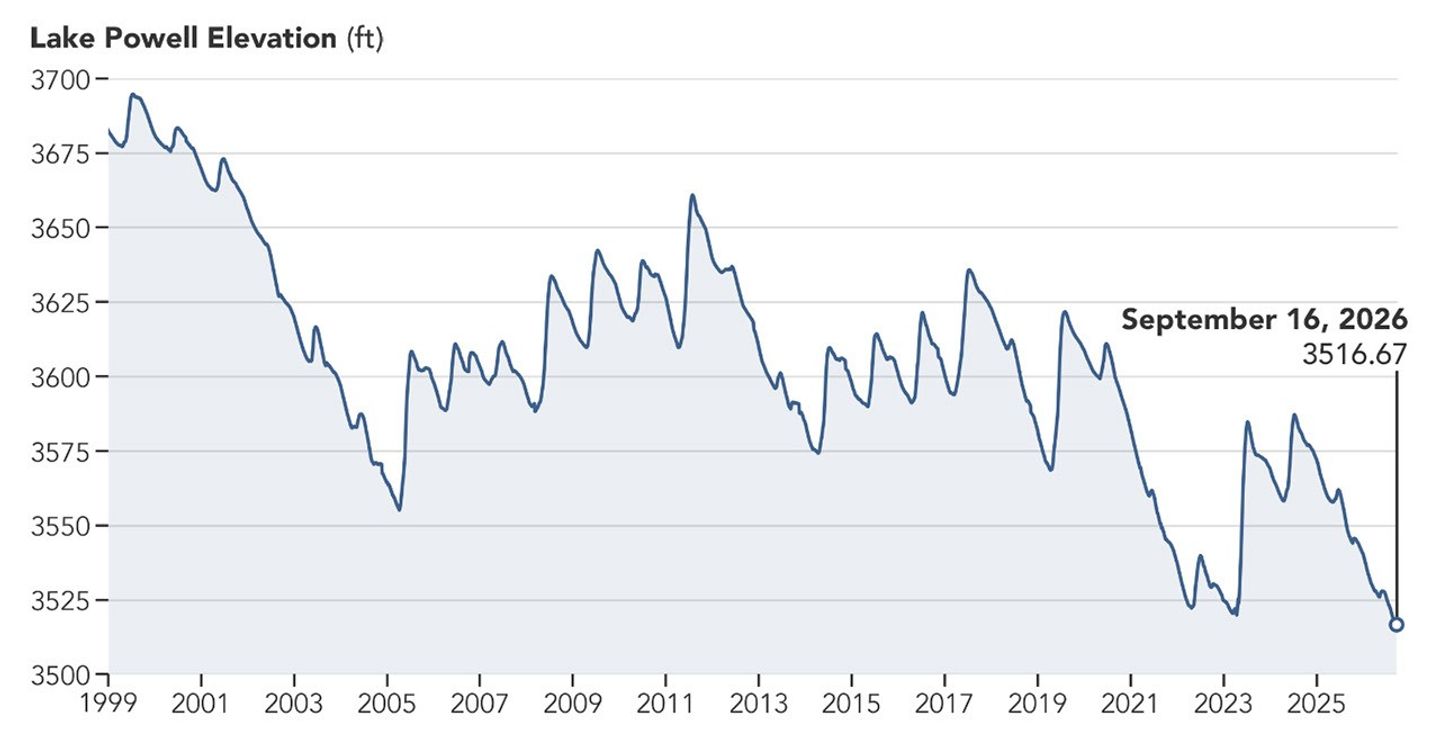
Water levels in Lake Powell have fluctuated but declined overall since 1999 and reached record lows in late August and early September 2026.
The effect of the megadrought in the U.S. Southwest in the 21st century is reflected in Lake Powell’s water level, as measured by the U.S. Bureau of Reclamation. The lake first reached a record low on August 15, 2026, and continued declining through early September. It remained above the minimum power pool elevation of 3,490 feet, below which the dam’s hydroelectric turbines can no longer generate energy effectively.
NASA Earth Observatory/Lauren Dauphin

The USBR took steps in April 2026 to stabilize Lake Powell and keep it from falling below the level needed for hydropower production—an outcome the agency deemed possible by August 2026 without intervention. USBR began releasing water from Flaming Gorge Reservoir in northern Utah and southern Wyoming into Lake Powell. It also reduced releases from Lake Powell into Lake Mead, canceled a “controlled flood” in April intended to build sandbars for fish habitat, and skipped a “cool mix” release in August aimed at protecting native species.

Drought in the U.S. Southwest has been ongoing since about the start of the 21st century—what experts have called a megadrought—and continues to strain water resources. Several projects and tools funded by NASA and powered in part by NASA Earth observations are helping decision-makers throughout the Colorado Basin monitor drought and respond to its effects.

At the Colorado River headwaters, for example, a dashboard based on the Western Land Data Assimilation System (WLDAS) provides real-time soil moisture, snow water equivalent, and evapotranspiration visualizations that inform Colorado’s drought task force, as well as weekly U.S. Drought Monitor maps.

Nearer to Lake Powell, the Drought Severity Evaluation Tool, co-developed with the Navajo Nation, helps leaders monitor localized drought indices, precipitation trends, and vegetation health across tribal lands. (With funding from NOAA’s National Integrated Drought Information System, its adoption expanded to Oklahoma’s Chickasaw and Choctaw Nations in 2025.) And the Colorado River Integrated Assessment tool, developed by Arizona State University researchers in partnership with the Central Arizona Project, consolidates improved modeling and NASA-satellite-validated information on snowpack, surface and groundwater storage, soil moisture, and more across the entire basin into a single interactive view.

NASA Earth Observatory images by Lauren Dauphin, using Landsat data from the U.S. Geological Survey and lake elevation data from the U.S. Bureau of Reclamation. Story by Lindsey Doermann.

References & Resources

You may also be interested in:

Stay up-to-date with the latest content from NASA as we explore the universe and discover more about our home planet.

Rising Waters Swamp Lake Naivasha

6 min read

Relentless rains are threatening a lake in Kenya’s Great Rift Valley that has become a key hub in the global…

Article

Elephant Butte Reservoir Runs Low

3 min read

Drought in the Rio Grande basin contributed to New Mexico’s largest reservoir dwindling to its lowest level in decades.

Article

Low Water at San Carlos Reservoir

4 min read

Drought and water releases drained the Arizona reservoir to levels that have led to widespread fish deaths.

Article

Source: science.nasa.gov

Cloudy Cloak Over the Northwest

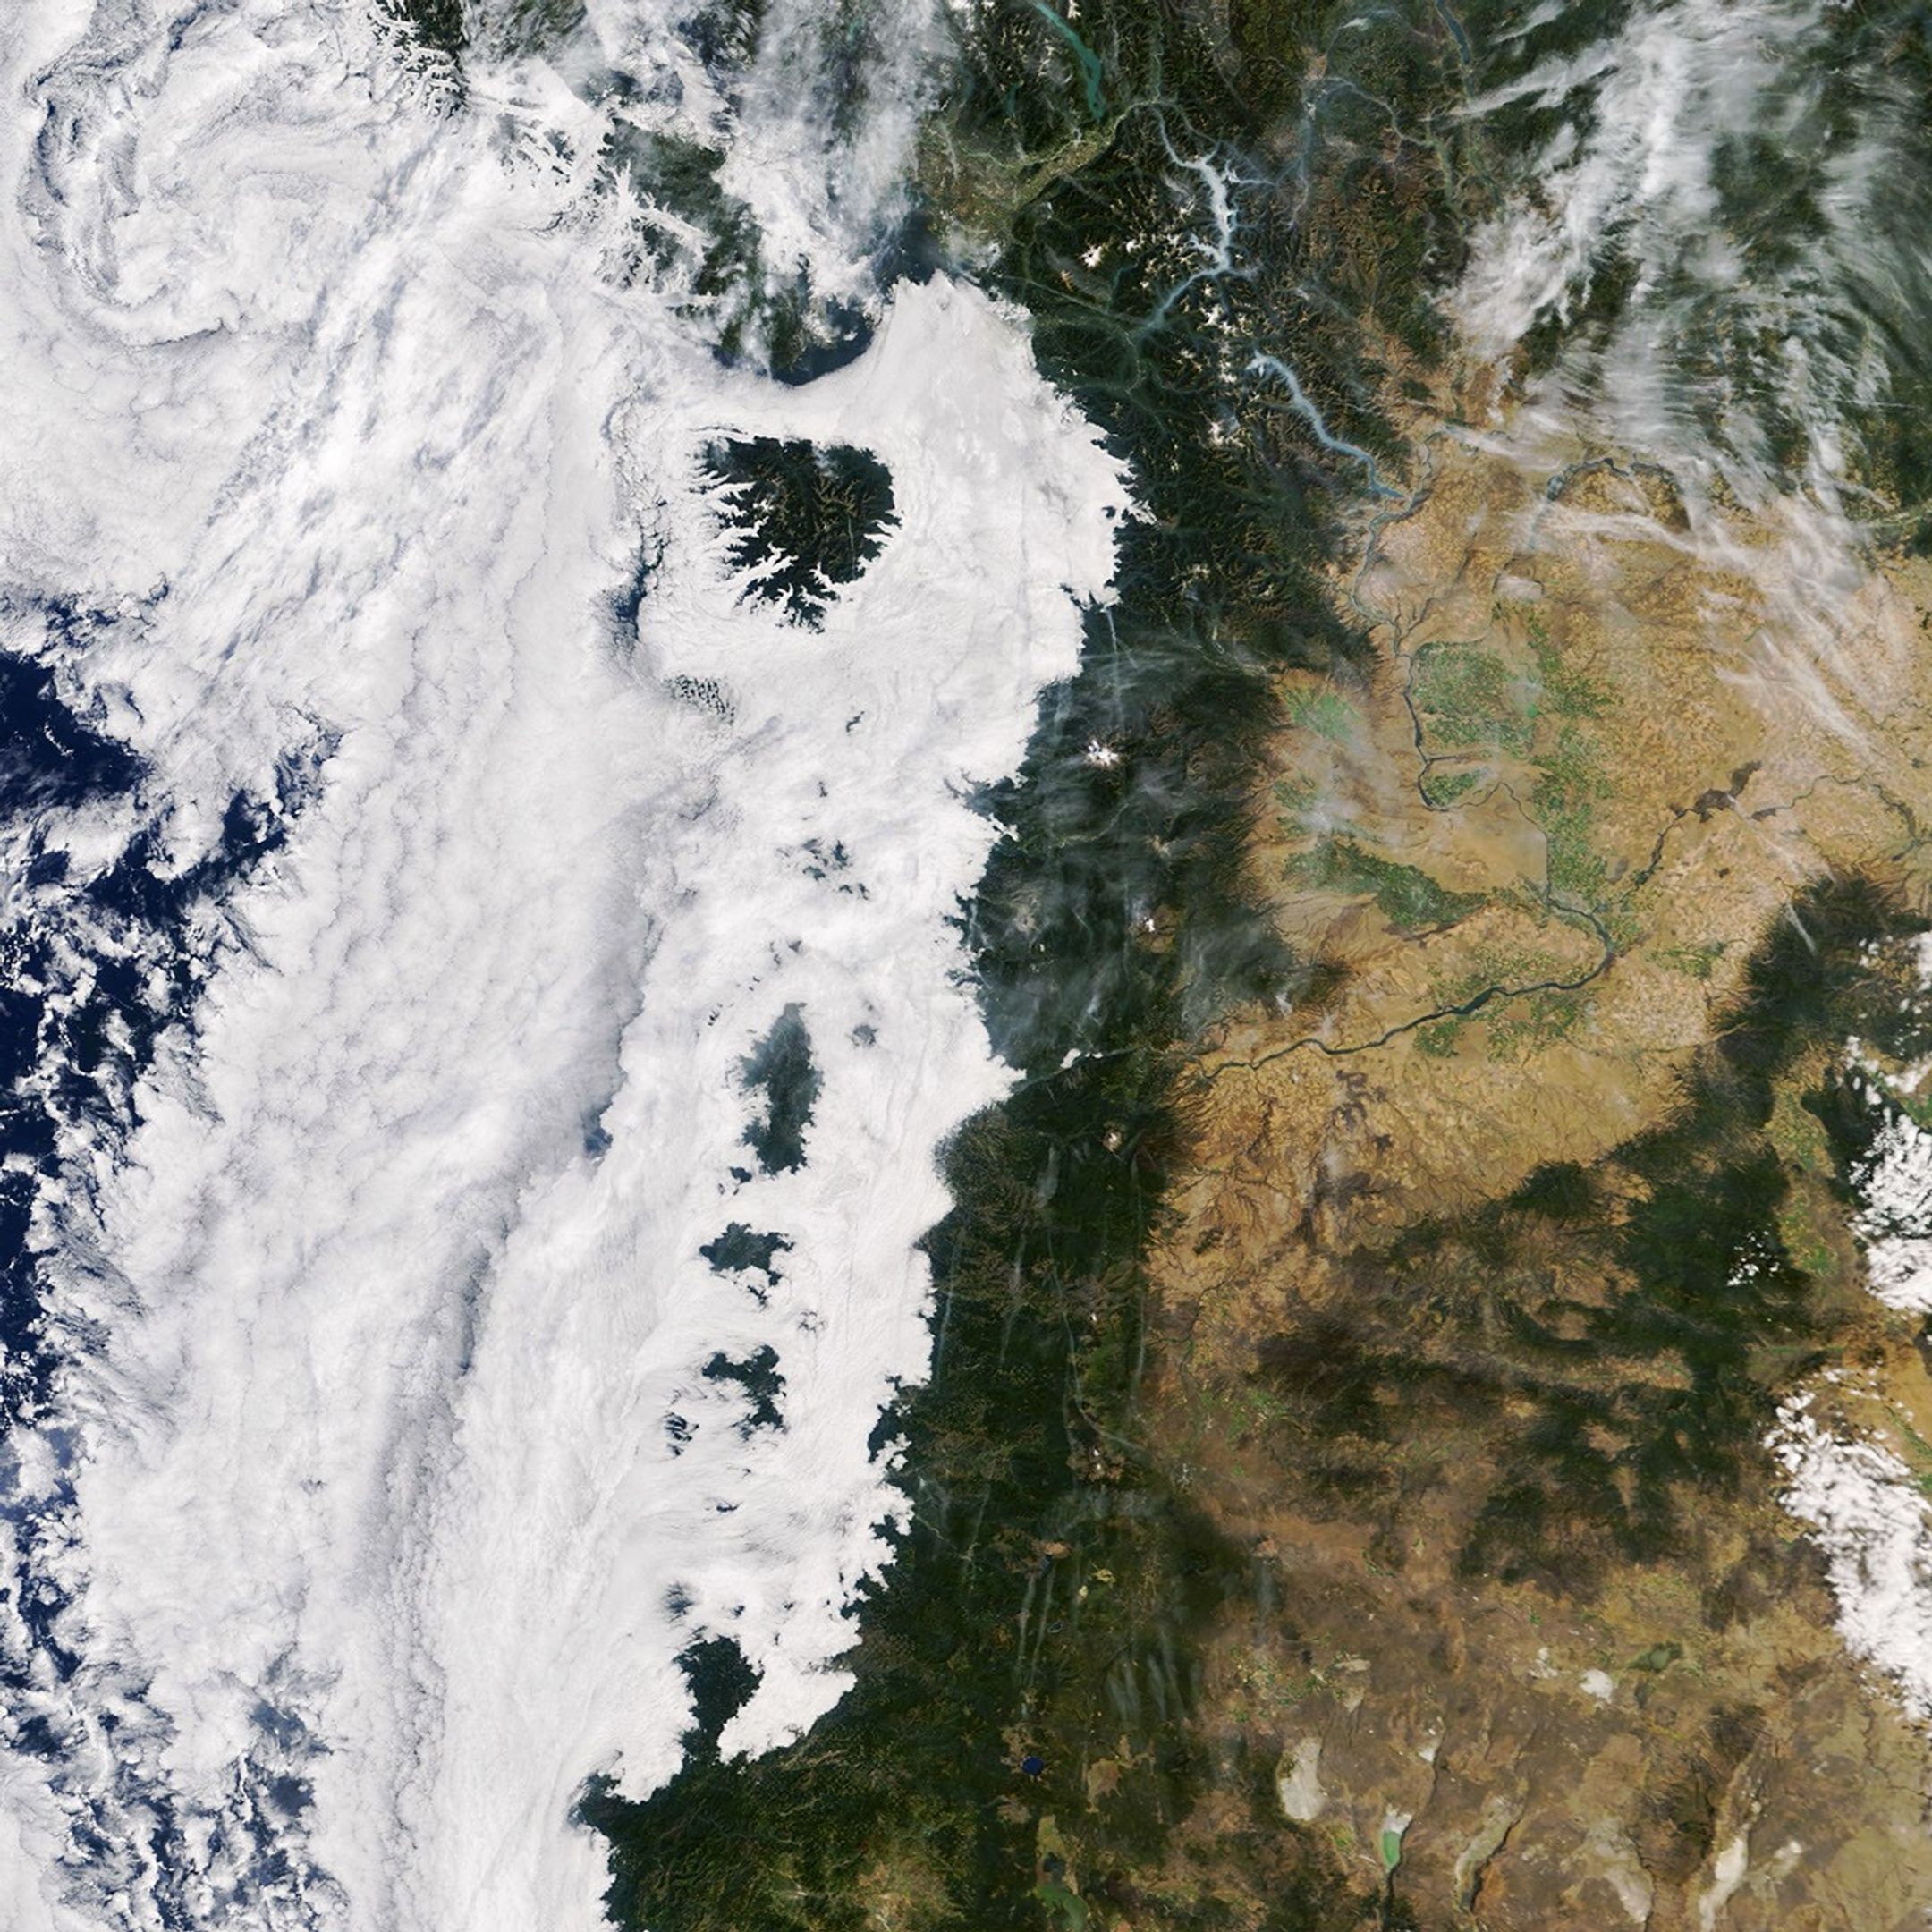
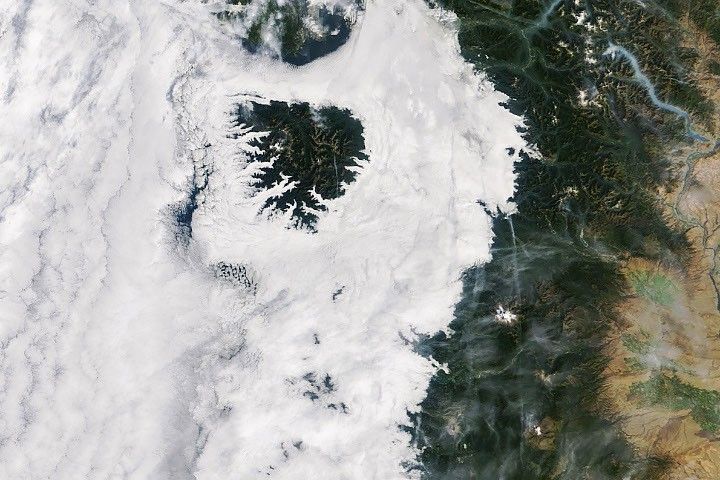
Low-lying clouds cover western Washington and Oregon between the Pacific coast and the foothills of the Cascade Range. Parts of the Olympic Mountains and Oregon Coast Range are visible above the clouds.
September 19, 2026
NASA Earth Observatory/Michala Garrison

Cool, marine air rolling off the Pacific Ocean led to a picturesque layer of morning clouds over western Washington and Oregon in mid-September 2026. Low-lying stratus clouds and fog extended as far inland as the western foothills of the Cascade Range. Near the coast, taller portions of the Olympic Mountains in Washington and the Oregon Coast Range appeared island-like, protruding above the cloud layer.

The MODIS (Moderate Resolution Imaging Spectroradiometer) on NASA’s Terra satellite shows the extent of the Pacific Northwest’s cloudy cloak on September 19, 2026, at about 10:45 a.m. Pacific Time (17:45 Universal Time). Abundant clouds also appear offshore over the Pacific, while smoke from wildland fires fills valleys in the North Cascades.

For several nights in a row, marine air flowed onshore, according to the National Weather Service, bringing with it low-level clouds known as marine stratus. These clouds form when moist air near the surface, trapped beneath a warmer air layer in a temperature inversion, cools enough for its water vapor to condense. The surge of cool, moist conditions was particularly strong early on September 19, producing cloudy conditions all the way up to the Cascade foothills. Some areas witnessed foggy conditions, where clouds extended down to the ground.

That same day, when NASA’s Aqua satellite passed over the area at about 4:15 p.m. Pacific Time (23:15 Universal Time), skies had cleared over much of the area. However, some marine clouds still clung to the Oregon coast, where temperatures stayed cooler than inland locations.

NASA Earth Observatory image by Michala Garrison, using MODIS data from NASA EOSDIS LANCE and GIBS/Worldview. Story by Lindsey Doermann.

References & Resources

You may also be interested in:

Stay up-to-date with the latest content from NASA as we explore the universe and discover more about our home planet.

El Niño Is Underway

4 min read

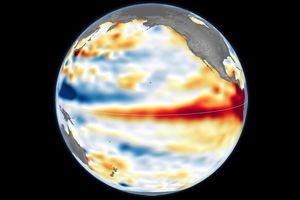
Satellite observations of sea surface height indicated that the 2026 event continued to strengthen in early June.

Article

El Niño Alters Marine Life in the Pacific

5 min read

Satellite measurements of chlorophyll at the sea surface signal shifts in the ocean’s nutrient supplies in mid-2026.

Article

Olympic Mountain Glory

4 min read

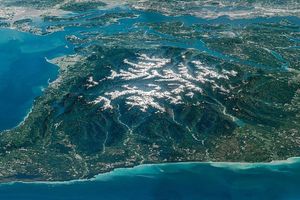
Snow-capped mountains carved by deep river valleys preside over northwestern Washington state.

Article

Source: science.nasa.gov

US-India Satellite Captures Time-lapse Video of Volcanic Eruption

In this animation, frames of NISAR data from December 2025 to August 2026 show the spread of lava from the northern crater of Krasheninnikov, a volcano pair on Russia’s Kamchatka Peninsula. In the image, the lava field appears brighter in the foreground than the surrounding surfaces.
 Credit: NASA’s Scientific Visualization Studio

Like tendrils on a vine, lava spreads out from the northern crater of Krasheninnikov, a volcano pair on the Pacific coast of Russia’s Kamchatka Peninsula. On July 30, 2025, an 8.8-magnitude earthquake had struck in the nearby ocean, apparently jolting one of the two volcanoes awake. A few days later, for the first time in nearly five centuries, Krasheninnikov started erupting. Since that day, the northern volcano has been spilling a steady, eastward-flowing field of molten rock and debris, and the NASA-ISRO Synthetic Aperture Radar (NISAR) mission has been tracking the changes in the landscape.

From its vantage point 464 miles (747 kilometers) above the surface, NISAR captured an image of Krasheninnikov on Dec. 25, 2025, just as the Earth-observing satellite was finishing post-launch checks and becoming operational. Twice every 12 days since — once as the satellite passed south to north, and again as it passed north to south — NISAR has returned to the same spot in orbit and taken detailed radar snapshots.

Researchers put 17 of the frames captured through mid-August into sequence, forming a time-lapse video that shows lava filling a smaller, inner caldera, then overflowing into a wider crater before widening into a fan. The animation highlights how NISAR’s observations can monitor the development of natural hazards, both for science and potentially for emergency response.

Though remote, many of Kamchatka’s dozens of volcanoes are closely monitored with ground instruments because they erupt frequently. Not so with Krasheninnikov, which has been quiet since about the year 1550. That NISAR’s L-band radar observed it at all speaks to the satellite’s near-global coverage of the planet’s land surface at resolutions in the dozens of feet; that it captured the erupting volcano over time shows the precision and reliability of its measurements.

“The consistency is crucial. Twice every 12 days, acquiring in this high-resolution mode and in two observation directions, this shows the promise of NISAR to closely monitor natural hazards,” said Matthew Pritchard, a member of the NISAR science team and geophysicist at Cornell University who analyzed the data used to create the animation. 

Images from microwaves

The detail in a single NISAR image results from the use of synthetic aperture radar, or SAR, a specialized processing technique pioneered by NASA’s Jet Propulsion Laboratory in Southern California for Earth observation from space. As the satellite orbits, the radar sends thousands of microwave pulses per second to Earth and receives the return signals, each of which is effectively a snapshot in time that contains information about the properties and characteristics of the surface below.

The SAR processing combines the many images of the same area, sharpening the view just as a lens brings a blurry object into focus. Each pixel in the individual frames of the Krasheninnikov time-lapse represents about a 30-foot-by-30-foot (10-meter-by-10-meter) square on the surface — about half the size of a tennis court.

Lava shows up lighter in the images due to the way that microwaves reflect more brightly compared with the surrounding surface, which, depending on the time of year, is either snow or bare ground. In addition to the lava field growing to the east, the video shows another flow to the northwest, one that likely formed before NISAR captured the first NISAR image.

When Pritchard was doing his doctoral research on Kamchatka volcanoes more than 20 years ago, analysis-ready radar data was difficult to come by, both because satellites didn’t revisit as often and the resolution of the images was relatively low.

Now in addition to getting frequent and comprehensive coverage of virtually all the planet’s roughly 1,300 active, above-sea-level volcanoes, the images are sharp down to the several-meter scale and are easily accessible via the cloud. 

“We’re seeing volcanoes around the world that we’ve never really had eyes on like this before,” said Pritchard.

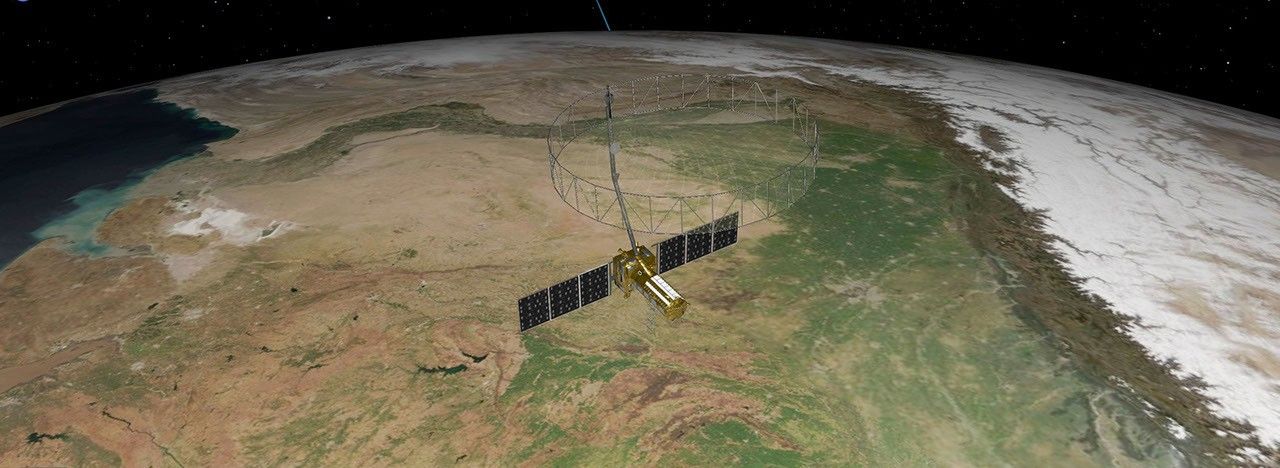
The NISAR satellite is the first free-flying space mission to feature two radar instruments: an L-band system and an S-band system. The systems are complementary due to their differing wavelengths. For example, the longer-wave L-band can pass through tree canopies, imaging the ground beneath. Meanwhile, depending on leaf sizes, S-band can collect observations of those canopies.

The data products from the NISAR mission’s L-band radar are available at the Alaska Satellite Facility Distributed Active Archive Center in Fairbanks, which hosts and distributes all NASA synthetic aperture radar data.

More about NISAR

Managed by Caltech for NASA, JPL leads the United States component of the project and provided the satellite’s L-band SAR and antenna reflector. The spacecraft bus and its S-band SAR were provided by ISRO (Indian Space Research Organisation).

The NISAR satellite is the first to carry two SAR instruments at different wavelengths, collecting data using the spacecraft’s giant drum-shaped reflector, which measures 39 feet (12 meters) wide, which is the largest radar antenna reflector NASA has sent into space.

To learn more about NISAR, visit: 

https://science.nasa.gov/mission/nisar/

Media Contacts

Andrew Wang / Andrew Good 
Jet Propulsion Laboratory, Pasadena, Calif. 
626-379-6874 / 818-393-2433 
[email protected] / [email protected] 

2026-064

Source: www.nasa.gov

Curiosity Blog, Sols 5010-5015: Checking out the Bands

3 min read

Curiosity Blog, Sols 5010-5015: Checking out the Bands

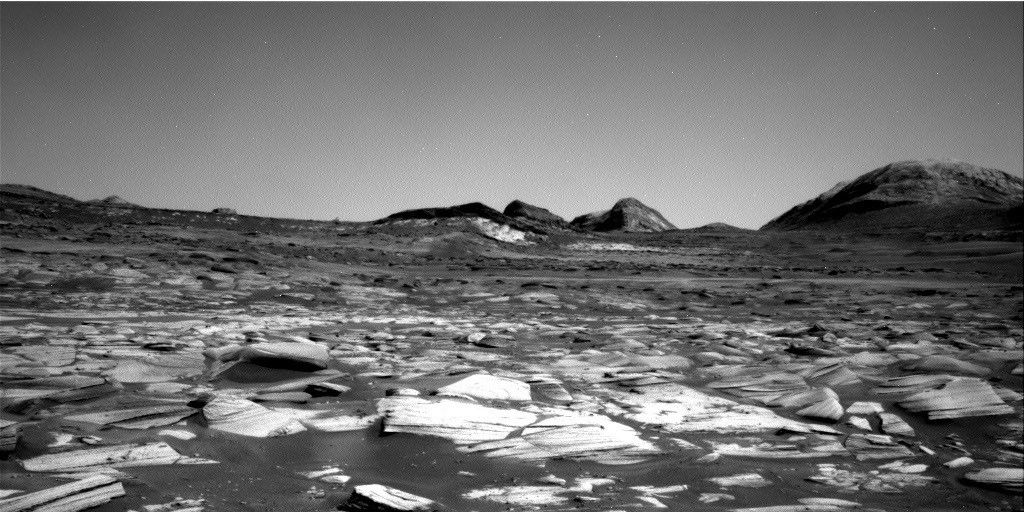
A grayscale image of the Martian surface taken by the Curiosity rover. The immediate foreground features a dense field of jagged, light-colored, thinly-layered rock fragments resting on a bed of darker sand or dust. The barren terrain gently slopes upward toward the horizon, where a cluster of dark, rugged hills and a larger, rounded mountain peak on the far right stand out against a smooth, featureless sky.
NASA’s Mars rover Curiosity acquired this image, showing the path ahead. The subtle banding can be picked out here in tonal differences. Curiosity captured the image using its Right Navigation Camera on Sept. 14, 2026 — Sol 5014, or Martian day 5,014 of the Mars Science Laboratory mission — at 02:05:20 UTC.
NASA/JPL-Caltech

Catherine O’Connell-Cooper, APXS Strategic Planner and Payload Uplink/Downlink Lead, University New Brunswick, NB, Canada

Earth planning date: Friday, Sept. 11, 2026

This week we had two planning days (Tuesday and Friday), as Monday was Labor Day in North America, where many of the Curiosity team are based. Labor Day (the first Monday in September) marks the end of summer holidays and thrills, and the return to more typical routines and back to school.

The MSL team has marked several important milestones within the past few weeks — marking our 14th “Landiversary” on Aug. 6 and surpassing the 1-kilometer elevation mark and our 5000th sol (Martian day) in early September. Our next big date is not until Nov. 26, the 15th anniversary of launch, and so it feels like Curiosity is also back to a more routine schedule at this point.

We are moving up the valley known informally as “Valle Grande.” In recent weeks, we climbed up over what we interpreted as an “erosional supersurface” (which marks a gap in the usual rock record) and are now traversing through a subtly banded area. Bands are 25-200 meters (about 80-650 feet) in diameter, with morphological changes, such as bands with more sand and less rocky outcrops (which often appear darker from a distance because there is more sand) and others where outcrops seem more continuous that allow us to mark out rough contacts between them.  

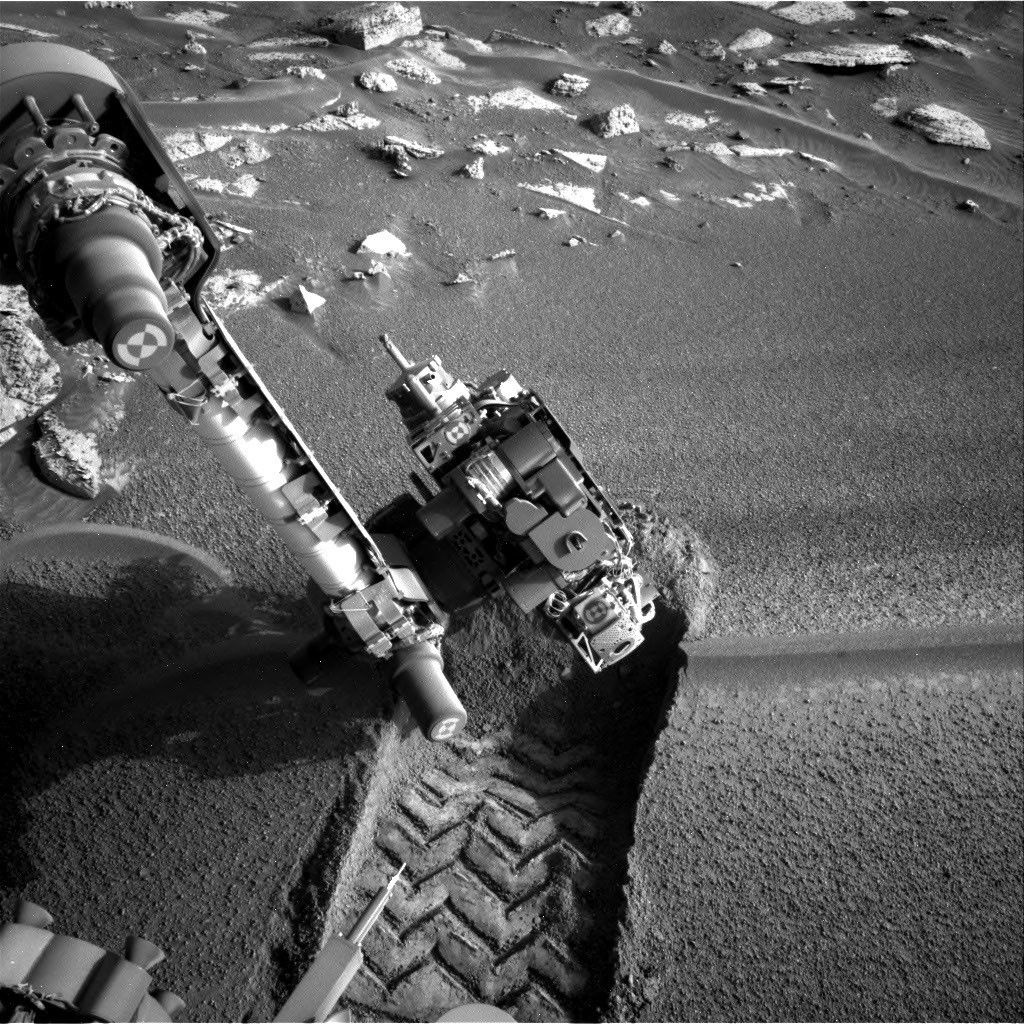
The terrain this week was characterized by sparse outcrops with a rough texture, often nodular, surrounded by lots of sand and coarse pebbly sand. On Tuesday APXS and MAHLI investigated brushed nodular bedrock at “Cerro Armazones” and “Monte Melimoyu.” ChemCam acquired LIBS on a knot of dark-toned nodules at “Tuta Huallpas” and the dark-toned float rock “Acllahuasi.”

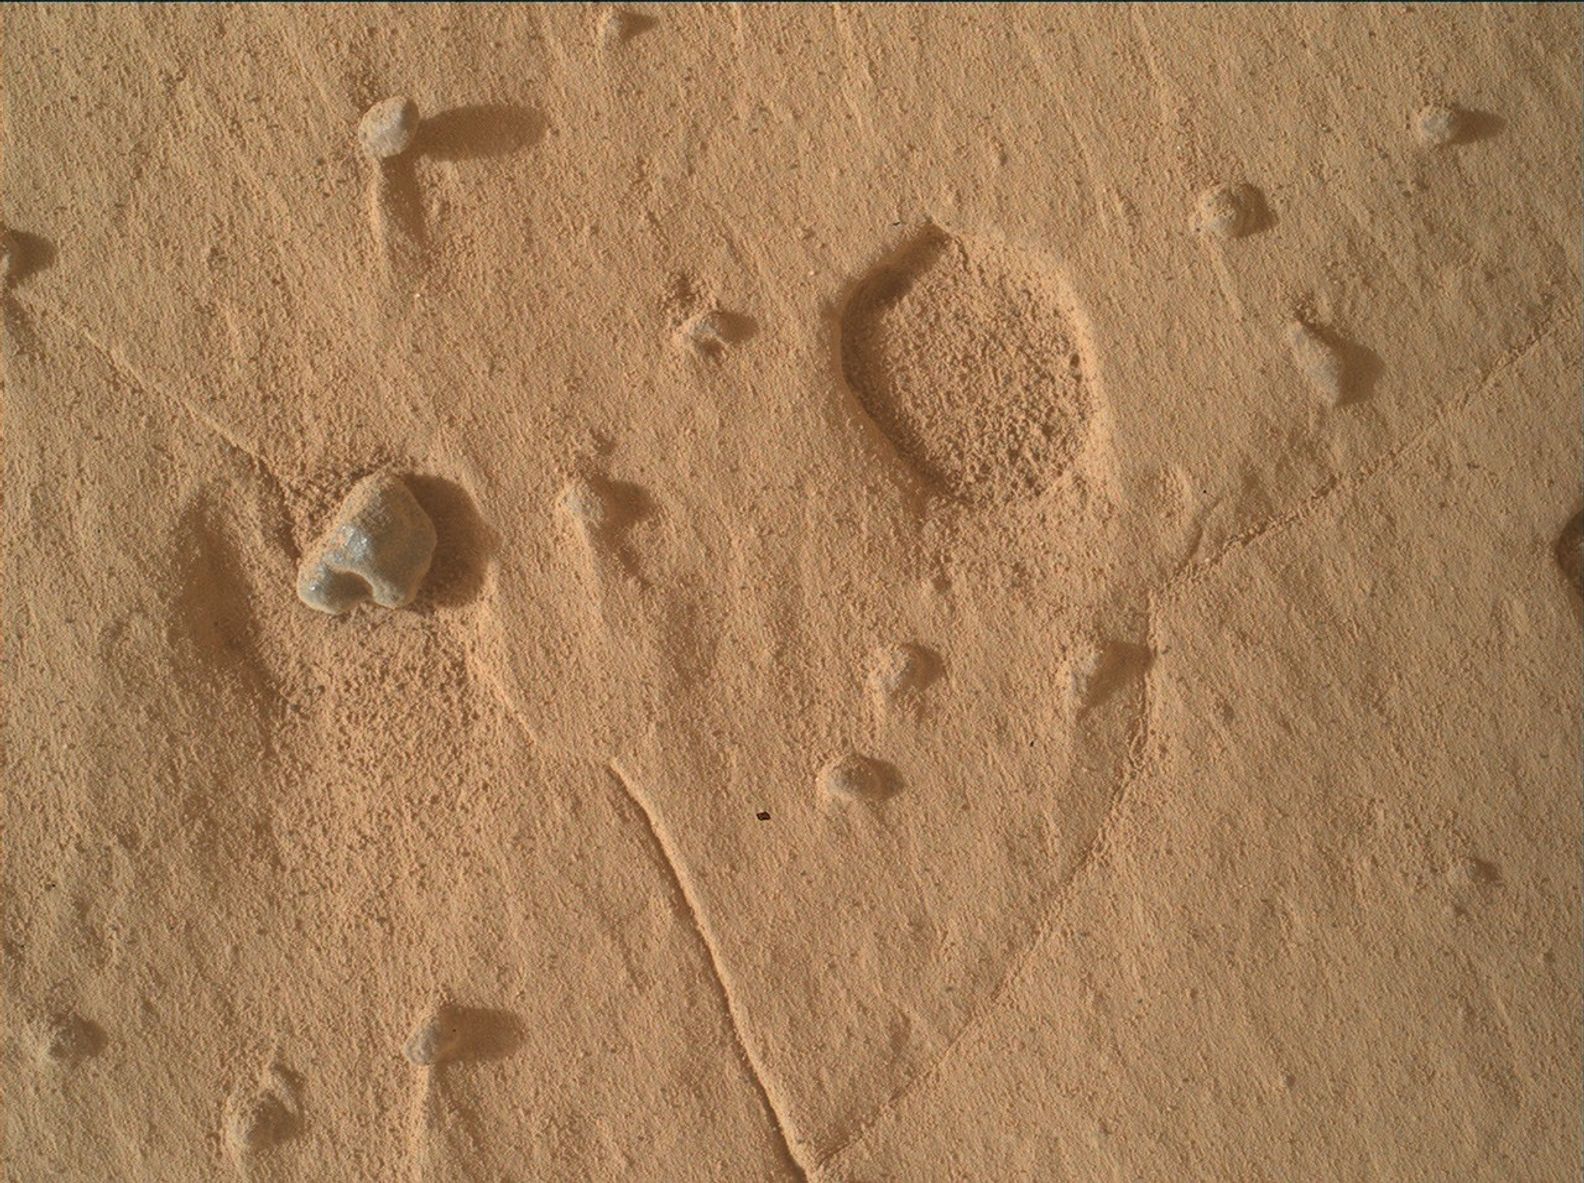
On Friday, after a drive of about 60 meters (nearly 200 feet), we found ourselves with mostly sand close to the rover and just one small rough-textured outcrop close enough for contact science and LIBS. Fortunately, the block was extremely interesting, with abundant small flakes and chips incorporated and laminated areas that are a bit smoother. We will investigate the rougher textures with MAHLI (“Yungay” and “Chiu Chiu”), APXS (Chiu Chiu) and ChemCam LIBS (“Puya Raimondii”) and a smoother area with LIBS (“Liolaemus Tacnae”).

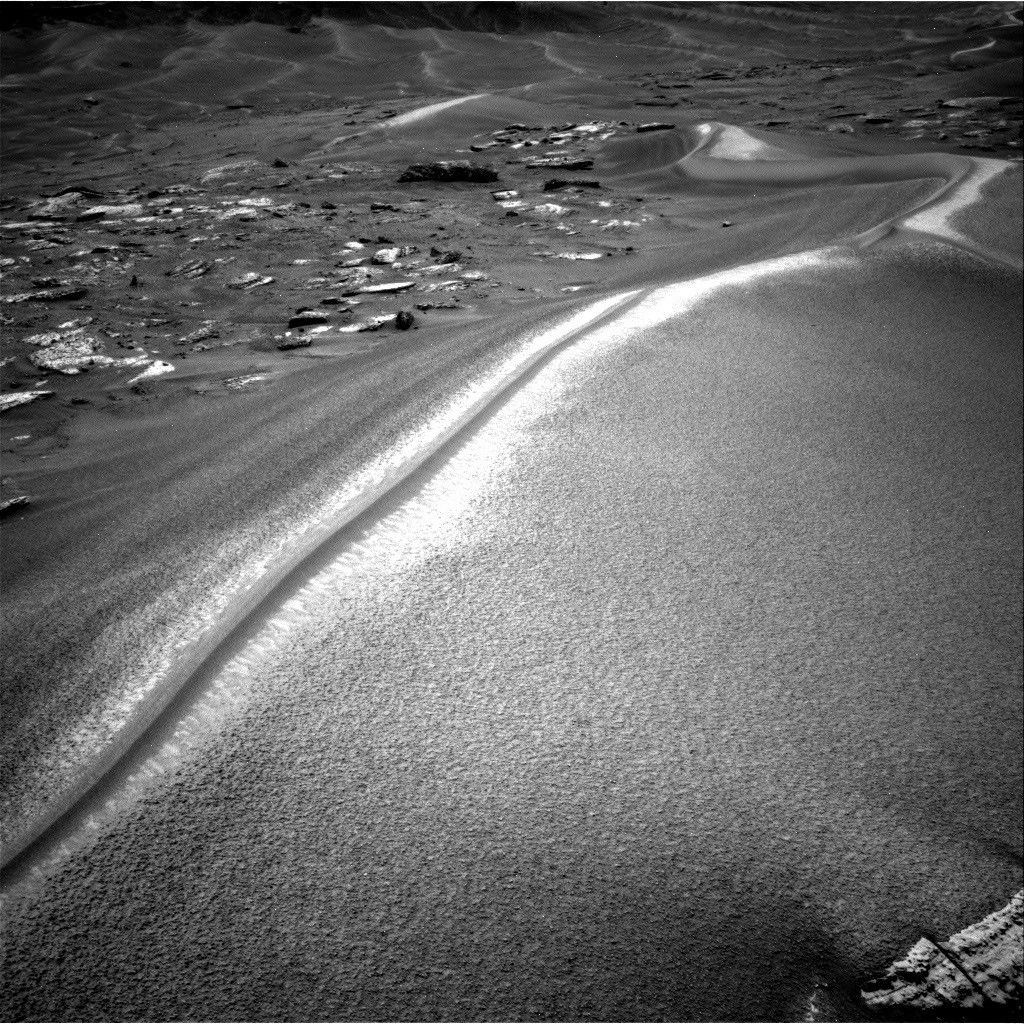
Across both plans, the ChemCam long-distance imager and camera teams were hard at work. In addition to near-field images, which focus on areas close to the rover, both Mastcam and ChemCam acquired several larger mosaics on the buttes on either side of us (“Mishe Mokwa” and “Cordillera”) and looking back to the small butte “La Linea.” Mastcam also took some mosaics documenting the “Chocolatal” scuff, which we analyzed last week, and a larger mosaic of the “Sullivan Field” sand field where Chocolatal is located. Sullivan Field contains sand ripples, mega ripples, and transverse aeolian ridges, and was named by the team in honor of the late Robert Sullivan, a world expert on Martian sands and cherished member of the Curiosity science team.

In parallel to all the geology activities, the environmental team planned their usual full schedule of monitoring activities, such as dust-devil movies, suprahorizon movies looking at the crater rim, and tau images, which look at dust in the atmosphere.

Navcam and Mastcam acquired images of the path ahead in our drive direction. The subtle bands can just about be picked out here, by looking at tonal differences. It will be very interesting to see how these look and vary from each other when we get close enough to each one.

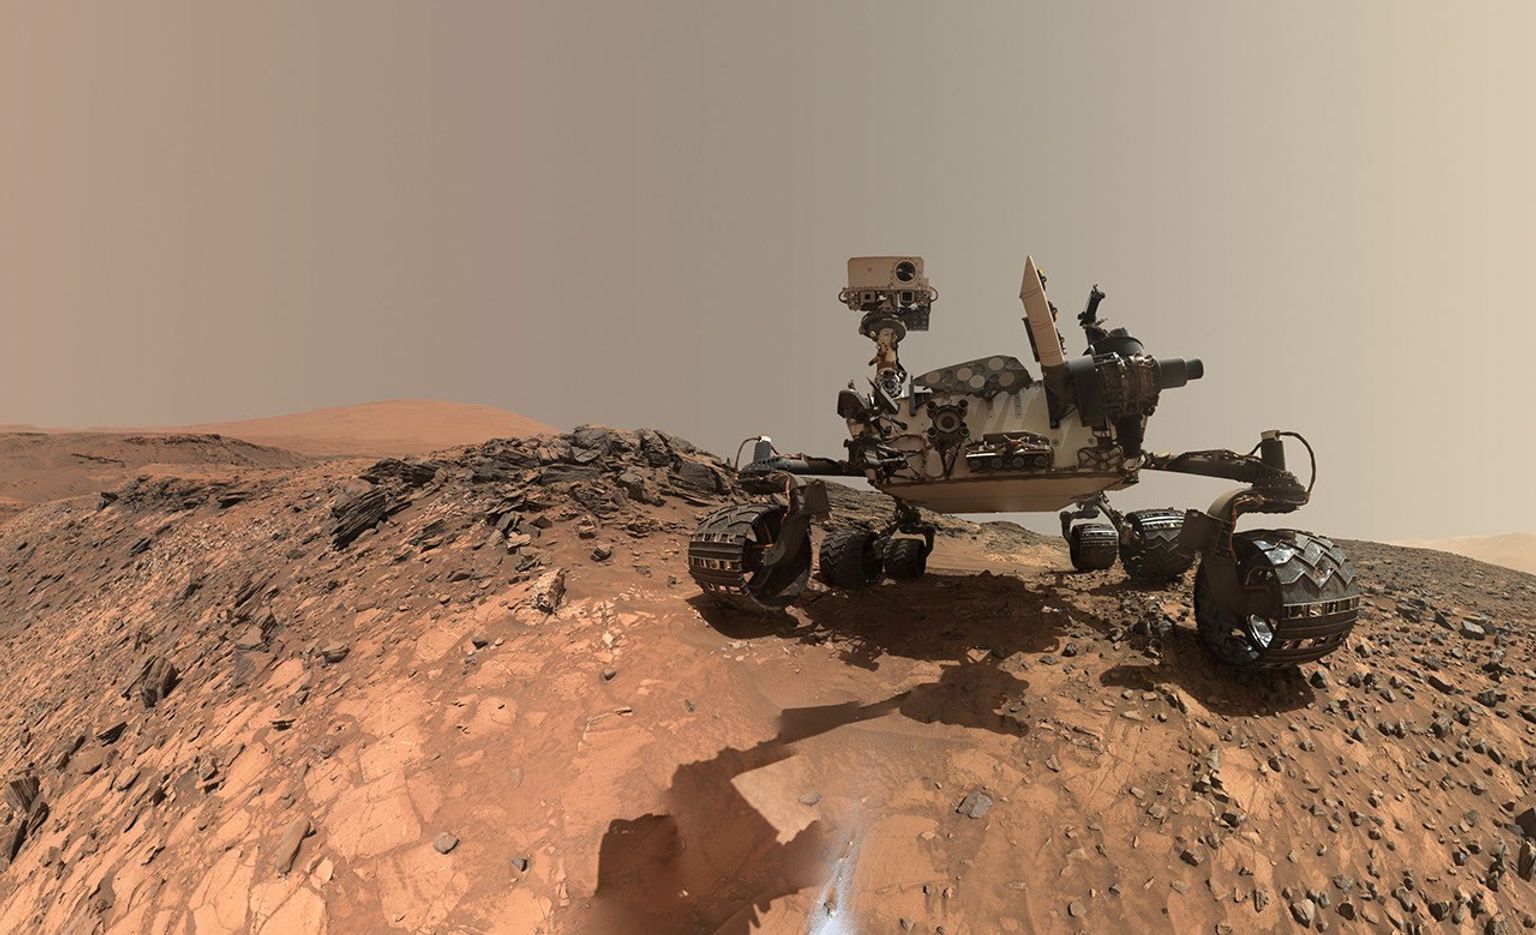
A rover sits on the hilly, orange Martian surface beneath a flat grey sky, surrounded by chunks of rock.
NASA’s Curiosity rover at the base of Mount Sharp
NASA/JPL-Caltech/MSSS

Details

Last Updated

Sep 22, 2026

Related Terms

Source: science.nasa.gov

Boom Year for Desert Blooms


August 19, 2025
August 30, 2026

Branching riverbeds and roads cut through rusty orange land in the Western Australian outback.
NASA Earth Observatory / Lauren Dauphin

Land in the Western Australian outback appears mostly rusty orange but contains areas of green, especially in riverbeds.
NASA Earth Observatory / Lauren Dauphin

Branching riverbeds and roads cut through rusty orange land in the Western Australian outback.
NASA Earth Observatory / Lauren Dauphin

Land in the Western Australian outback appears mostly rusty orange but contains areas of green, especially in riverbeds.
NASA Earth Observatory / Lauren Dauphin


August 19, 2025

August 30, 2026


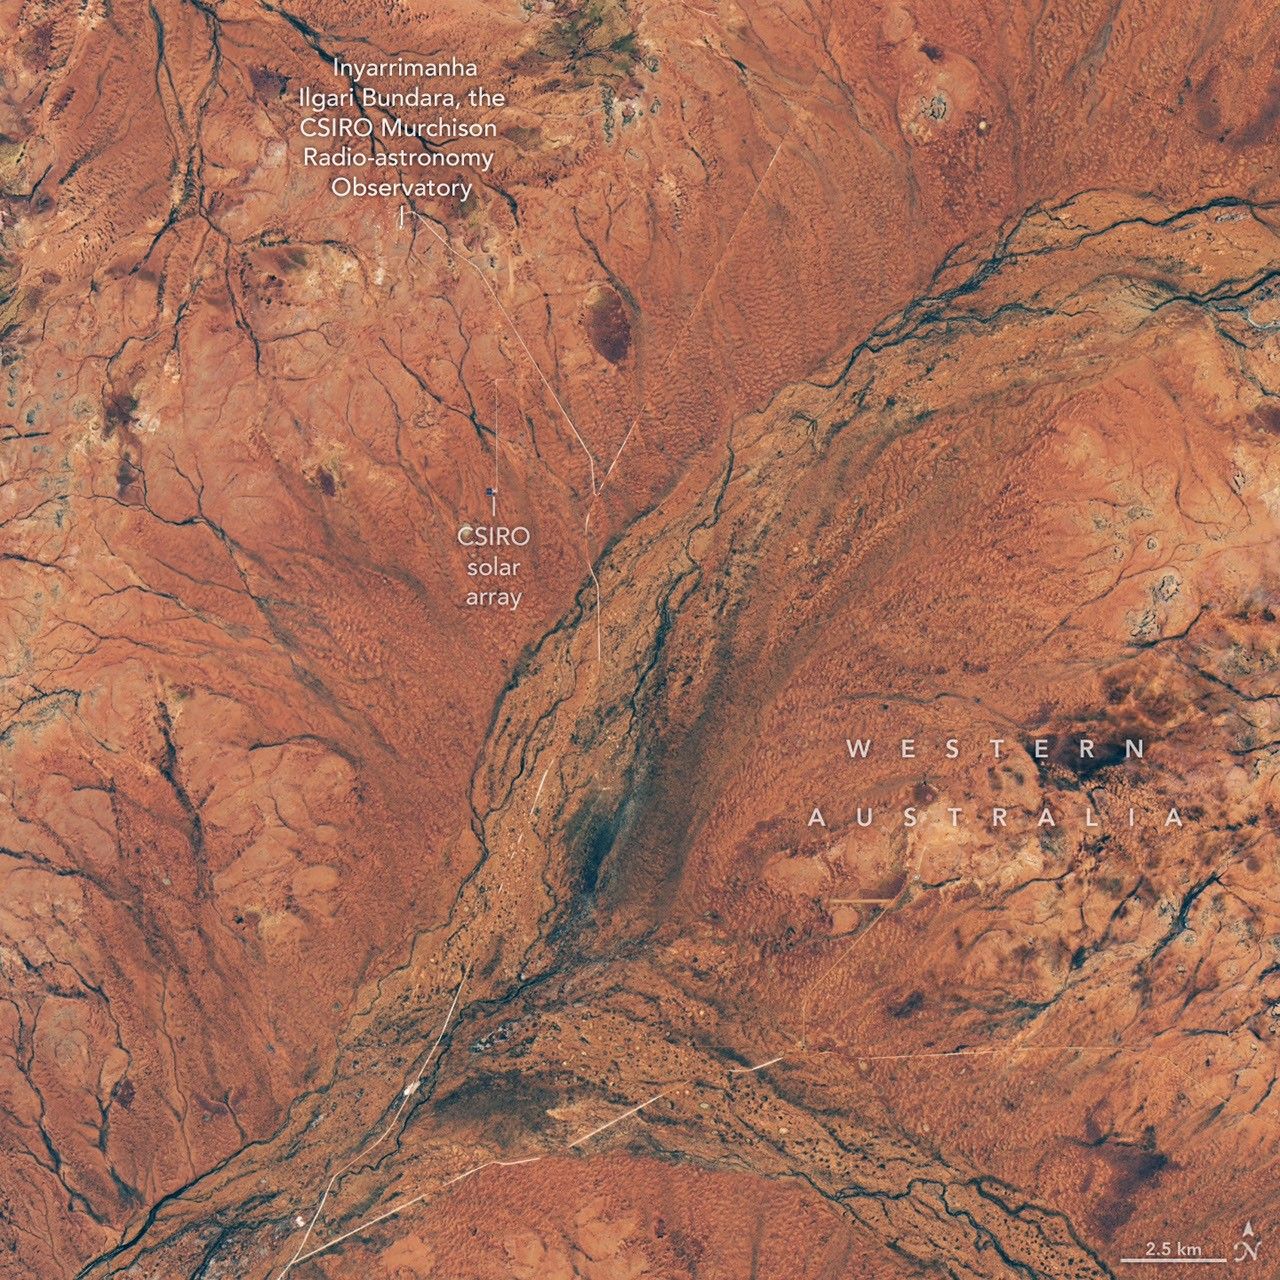
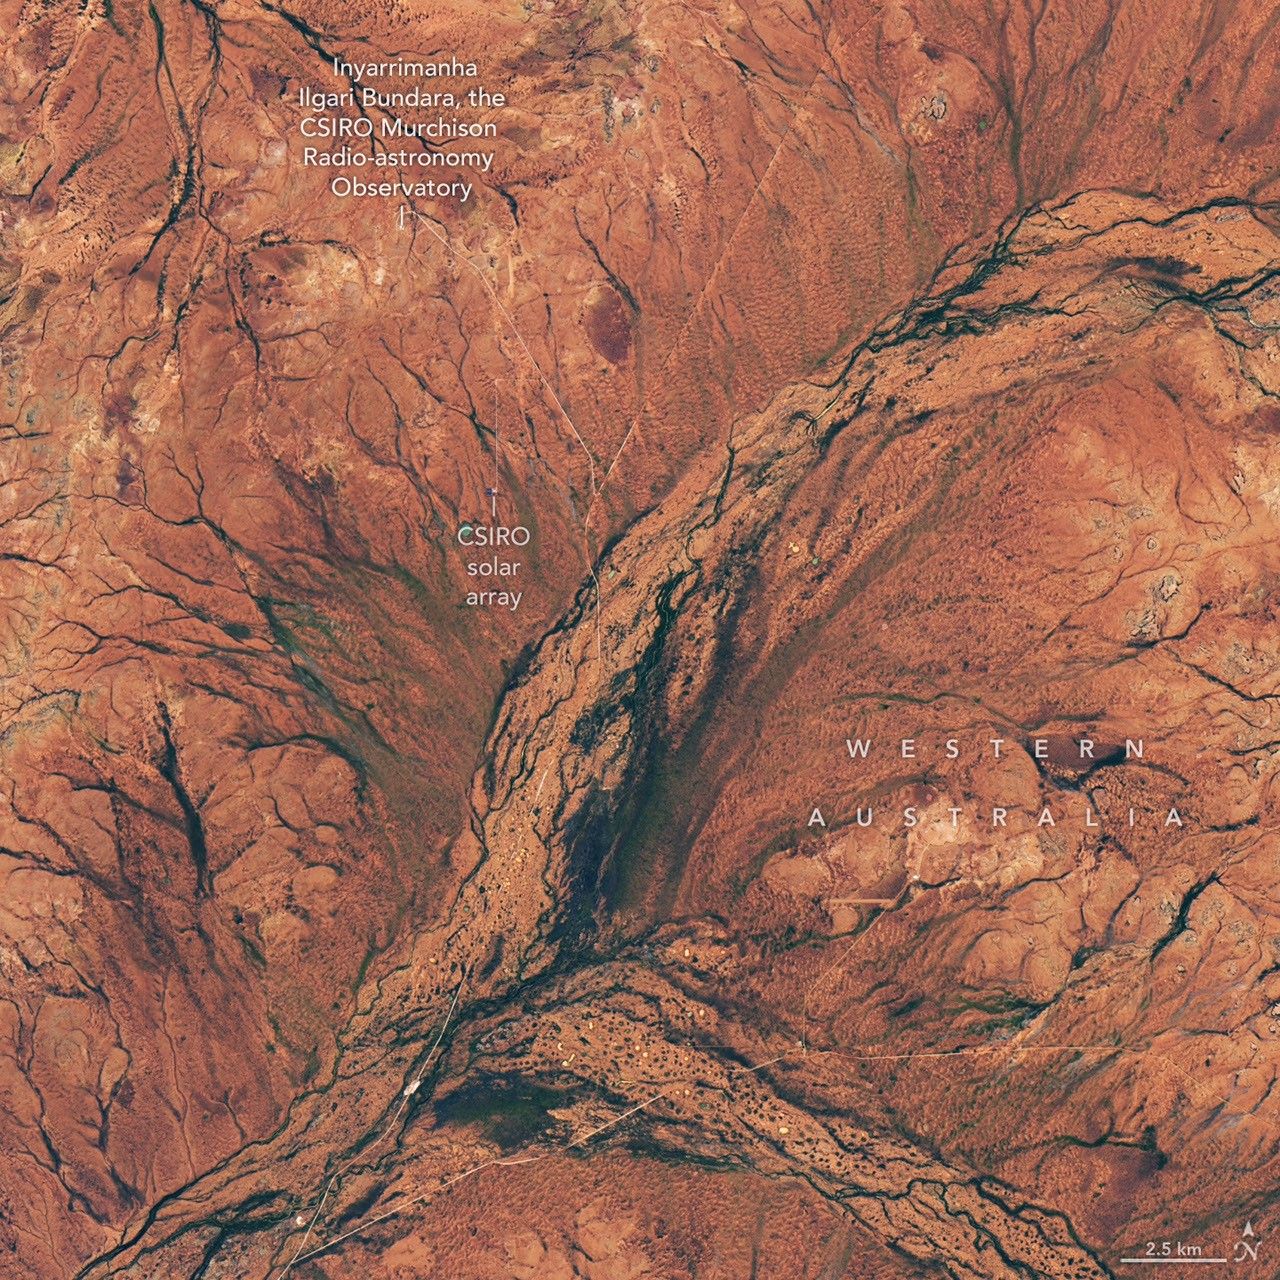
Arid shrublands in Western Australia were bursting with life in late austral winter 2026, when a profusion of wildflowers brought vivid colors to the rusty ochre landscape. After several wetter-than-normal months earlier in the year, dormant seeds in the soil awoke to produce carpets of blooms. Local experts think the display could be the best the area has seen in nearly two decades.

The images above, captured with the OLI (Operational Land Imager) on the NASA-USGS Landsat 8 satellite, compare the more verdant landscape of late August 2026 (right) with a similar time in 2025 (left), when it was drier. This area is located about 600 kilometers (370 miles) north of Perth in the Murchison region, one of Western Australia’s main areas for grazing sheep and cattle. The local vegetation includes grasses, saltbush, and the slow-growing evergreen mulga tree.

White flowers cover the ground amid sparsely spaced shrubby trees.
White flowers carpet the Western Australian outback.
© CSIRO Australia, September 16, 2026

Every so often, a variety of wildflowers makes an appearance, too. In 2026, rainfall totals were above average in June and very much above average in August due to several cold fronts moving through the area, according to Australia’s Bureau of Meteorology. The rains helped rouse a diverse mix of flowers to bloom across the outback, including on a radio astronomy site managed by the Commonwealth Scientific and Industrial Research Organisation (CSIRO), Australia’s national science agency. The flower show included some threatened species, which the observatory has helped monitor on its formerly pastoral land.

Though the spectacle underfoot might have momentarily stolen the show, Inyarrimanha Ilgari Bundara, the CSIRO Murchison Radio-astronomy Observatory, is primarily focused on what’s overhead and the exploration of deep space. At the Murchison site, CSIRO operates several antenna arrays that observe and catalog objects in the southern sky. The remote facility is situated within a “radio quiet” zone, where terrestrial communications and electronic devices are controlled to limit electromagnetic interference with the instruments.

A field of pink wildflowers occupies the foreground. Four white dish antennas, part of a radio astronomy observatory, are out of focus in the background.
Mulla mulla flowers appear in front of CSIRO’s Australian Square Kilometre Array Pathfinder (ASKAP) radio telescope.
© CSIRO Australia, September 16, 2026

Other telescopes in CSIRO’s purview in Australia have played crucial roles in NASA missions from the agency’s early years to today. The Murriyang radio telescope in Parkes, New South Wales, tracked Mariner 2—the first successful planetary science mission—in 1962 and was an important receiving station for the Apollo 11 mission to the Moon in 1969. CSIRO also manages and operates the Canberra Deep Space Communication Complex, one of three facilities in NASA’s global Deep Space Network that supports interplanetary spacecraft missions and collects radar and radio astronomy observations. Both supported the Artemis II mission in April 2026.

NASA Earth Observatory images by Lauren Dauphin, using Landsat data from the U.S. Geological Survey. Photos © CSIRO Australia, September 16, 2026. Story by Lindsey Doermann.

References & Resources

You may also be interested in:

Stay up-to-date with the latest content from NASA as we explore the universe and discover more about our home planet.

Bountiful Roebuck Bay 

4 min read

Tidal and seasonal shifts leave their mark on this crescent-shaped, productive bay in Western Australia’s Kimberley region.

Article

An Epic View of the Seasons

6 min read

The tilt in Earth’s axis of rotation makes the apparent position of continents shift with the seasons in imagery from…

Article

Great Balls of Fire

4 min read

An astronaut on the International Space Station was surprised to photograph a shower of light streaking through the darkness while…

Article

Source: science.nasa.gov

APOD: 2026 September 23 – A New Lunar Crater: McGetchin

APOD

Astronomy Picture of the Day

Discover the cosmos! Each day a different image or photograph of our fascinating universe is featured, along with a brief explanation written by a professional astronomer.

An image of the lunar surface with a large depression at the center surrounded by raised ridges that slope down back to the surface.An image of the lunar surface speckled wth impressions (craters) of various small sizes.

A New Lunar Crater: McGetchin

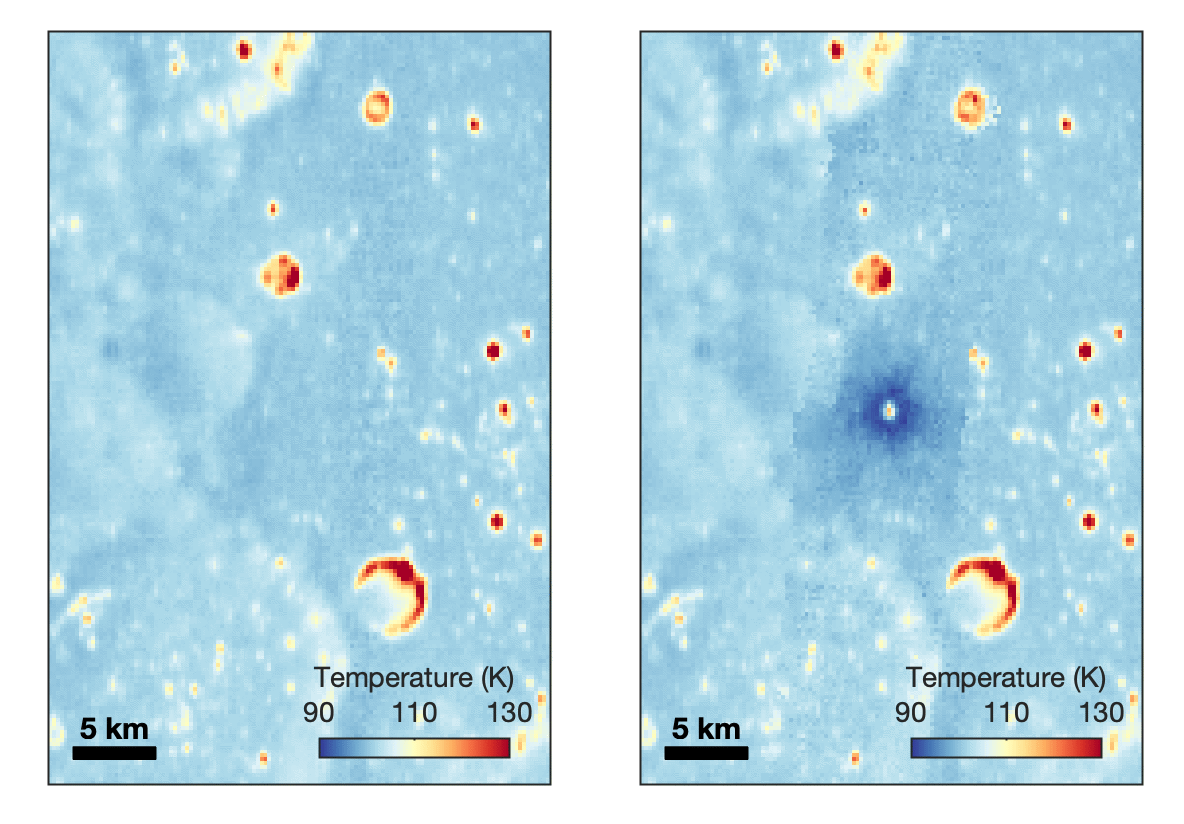
Explanation: A once-in-a-lifetime crater has appeared on the Moon! A comet or asteroid roughly the size of a humpback whale (approximately 10-20 meters, 30-60 feet) crashed into the Moon sometime between April and May of 2024. The Lunar Reconnaissance Orbiter (LRO), with its monthly monitoring of the Moon, captured today’s images of the lunar surface before and after the event. The resulting crater, named after Apollo-era lunar scientist McGetchin, is two soccer fields across. Craters of this size are only expected once every 132 years! Follow up thermal imaging revealed a large cold spot that surrounds the warm crater. Surface impacts will puff up the loose lunar sediment, or regolith, making it less dense and harder to retain heat. This event affected an area much larger than the visible crater, which will inform humanity’s understanding of surface impacts and the evolution of the Moon’s surface. It also reminds us all to be thankful for Earth’s atmosphere.

APOD’s submission email has changed. Please see APOD Submissions.
APOD’s main NASA site is moving: From apod.nasa.gov to science.nasa.gov/apod
Tomorrow’s picture: the great unknown

Date: September 23, 2026
Credit: NASA/GSFC/Intuitive Machines
Authors & editors: Keighley Rockcliffe, Robert Nemiroff, Jerry Bonnell, Cecilia Chirenti
A service of: ASD at NASA / GSFC,
NASA Science Activation & Michigan Tech. U.

Source: science.nasa.gov

Risk of Hydrazine Use Following Freeze–Thaw Exposure

For more information, contact Jonathan E. Jones, Langley Research Center, [email protected]

Download the PDF version

The purpose of this Technical Bulletin is to communicate the risks associated with freeze–thaw cycles in hydrazine monopropellant systems and to provide general recommendations for mitigating damage, operational hazards, and loss of system reliability in propulsion and auxiliary hydrazine systems.

Background
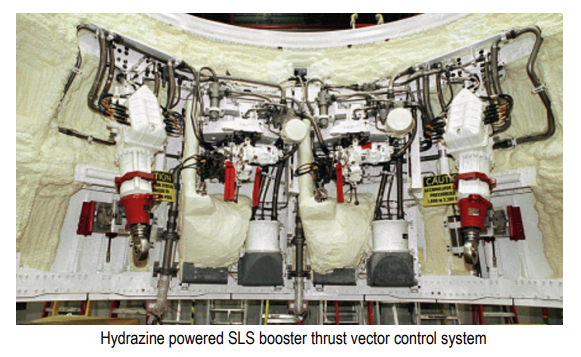
Hydrazine (N2H4) freezes near 1.6°C, and its phase transition is known to introduce risks to flight hardware. Multiple NASA programs have historically encountered hydrazine freeze related issues:

• Space Shuttle APU hydrazine lines were vulnerable to freeze induced contraction followed by thaw induced over expansion, capable of bursting plumbing. Shuttle flight rules permitted no more than two freeze–thaw cycles before considering the system degraded or failed.1

• Voyager propulsion systems faced mission threatening scenarios as hydrazine temperatures approached the freezing/slush formation range (0.1–1.6°C). Detailed thermal modeling was required to prevent freezing of lines, blockage, and thruster malfunction.2

• Hydrazine thermodynamic properties confirm significant changes in density and pressure across phase transitions, emphasizing the sensitivity of propellant lines to freeze–thaw stress.3

These combined lessons form the basis for risk identification and mitigation.

Problem Summary
Freeze–thaw exposure of hydrazine systems presents the following critical risks:

• Structural Damage Hydrazine contraction during freezing allows additional propellant into confined lines, producing “superpacked” conditions that cause line or fitting rupture upon thaw.2

• Valve, Seal, and Diaphragm Compromise Elastomeric components and precision valve seats may experience cracking, distortion, or loss of sealing capability due to differential thermal expansion. Voyager thermal assessments highlighted susceptibility of long stainless steel runs to asymmetric temperature profiles.2

• Line Blockage and Slush Formation Partially thawed hydrazine can remain “slushy,” restricting flow, altering mass flow rates, and causing thruster hard starts or misfires.2

• Hazardous Leaks Freeze induced damage may allow hydrazine to escape confinement, posing significant toxicity, reactivity, and ground crew exposure hazards.

• Loss of System Reliability As documented in Shuttle operations, hydrazine systems exposed to freeze–thaw cycles become life limited, reducing redundancy and mission availability.1

• Thermal Margin Uncertainty Voyager experience demonstrated that simple temperature readings cannot reliably determine true line temperature, necessitating high fidelity thermal modeling.2

Recommendations Prevention Measures
• Maintain Hydrazine Above Freezing Margin Keep all hydrazine systems above freezing, using heaters, insulation, blankets, or warm gas purge. Include uncertainty analysis in modeling and testing to ensure appropriate margins against freezing are maintained during all phases of operation.

• Avoid Uncontrolled Cooling During Ground Operations Ensure that tank, line, and valve components remain in environmentally controlled areas until integrated into the vehicle.

Post Freeze Response Protocol
If freezing cannot be ruled out:

• Suspend System Use Do not operate the hydrazine system until engineering evaluation is completed.

• Assess Number of Freeze–Thaw Cycles Treat each cycle as life limiting, an engineering assessment (static and fatigue) should be conducted based on conservative estimates of the line pressures during/after freeze/thaw cycles to understand potential line/component damage. Appropriate margin should be applied based on analysis uncertainty and/or underlying assumptions.

• Conduct Integrity Verification Perform pressure decay tests, NDE (if design allows), and valve health assessments.

• Implement Slow, Uniform Thawing To prevent thaw induced over pressure, warm hardware gradually and evenly. Shuttle experience with “superpacking” reinforces the necessity of controlled thawing.

Thruster and Valve Operational Readiness
• Ensure catalyst beds and valves reach proper thermal operating conditions before commanding any flow.

• Conduct pre start thermal stabilization periods, especially when flight readiness temperatures are marginal.

Thermal Modeling and Monitoring
• Utilize high fidelity thermal line modeling, emulating Voyager’s detailed propellant line modeling approach.2

• Avoid relying solely on bulk plate or tank temperatures to infer line readiness.

• Use thermal analysis and test to guide instrumentation placement on of the flight systems to monitor key temperatures set points.

Documentation and Incident Tracking
• Record all freeze exposures as reportable anomalies.

•Assign engineering disposition and track hardware life reduction accordingly.

Conclusion
Hydrazine freeze–thaw cycles present significant structural, operational, and safety risks for propulsion and auxiliary systems. Historical NASA programs show that prevention of hydrazine freezing is the most effective mitigation, with freeze exposure requiring formal engineering assessment, life limit adjustments, and controlled recovery procedures. Adhering to these recommendations will reduce risk to personnel, flight hardware, and mission success.

References
1. Space Shuttle Operational Flight Rules, Vol. A. All Flights, Mission Operations Diretorate, 20 June 2002. 2. W. C. Ledeboer, “Creating a Voyager Thermal Model 39 Years Into the Flight Mission, Along With Model Correlation and Application,” 8 July 2018. 3. J. L. Haws and B. G. Harden, “Thermodynamic Properties of Hydrazine,” Nov 1965.

Source: www.nasa.gov

FFA 2026 Hyperwall Schedule

FFA 2026

Join NASA in the Exhibit Hall (Booth #648) for Hyperwall Storytelling by NASA experts. Full Hyperwall Agenda below.

TUESDAY, OCTOBER 20

10:00 AM NISAR Updates, One Year After Launch Paul Rosen, Marco Lavelle 
10:15 AM NOAA Geostationary Satellites: Valuable Data for both Research and Operational Use Dan Lindsey
3:00 PM  Discovering Mineral Resources with NASA Imaging Spectroscopy Robert O. Green
3:15 PM 
The Importance of Satellite Ocean Observations at NOAA
Paul Chang

Source: science.nasa.gov